TechOpsGuys.com Diggin' technology every day

November 4, 2011

Host based sFlow for monitoring

Filed under: Monitoring — Tags: — Nate @ 12:32 am

Just came across this post, seems pretty cool. I’ve been a fan of sFlow for quite a while now, though have not yet tried host sFlow (though have been aware of it’s existence for a year or so).

I know the pain monitoring JMX for sure, many eons ago I had a java engineer make me some bean shell scripts that allowed me to poll JMX services once every few seconds while maintaining a single JVM for days or weeks at a time, it was soooo handy. The mod-sflow for apache sounds really neat too.

I’ve also used this tiny jsp to poll tomcat heap, has worked very well without having to resort to jmx

<% Runtime runtime = Runtime.getRuntime(); %>
<%=runtime.freeMemory()%> memory free of <%=runtime.totalMemory()%> total memory


January 5, 2010

Acknowledge Nagios Alerts Via Email Replies

Filed under: Monitoring — @ 3:59 pm

Monitoring should be annoying by design – when something is broken, we need to fix it and we need to be reminded it needs fixing until it gets fixed. That’s why we monitor in the first place. In that vein, I’ve configured our Nagios server to notify every hour for most alerts. However, there are times when a certain alert can be ignored for a while and I might not have a computer nearby to acknowledge it.

The solution: acknowledge Nagios alerts via email. A quick reply on my smartphone and I’m done.

Setting it up is fairly simple and involves a few components: an MTA (Postfix in my case), procmail (might need to install it), a perl script and the nagios.cmd file. I used the info in this post to get me started. My instructions below were done on two different CentOS 5.4 installs running Nagios 3.0.6 and Nagios 3.2.0.

Procmail
Make a /home/nagios/.procmailrc file (either su to the nagios user or chown to nagios:nagios afterwards) and paste in the following:

LOGFILE=$HOME/.procmailrc.log
MAILDIR=$HOME/Mail
VERBOSE=yes
PATH=/usr/bin
:0
* ^Subject:[    ]*\/[^  ].*
| /usr/lib/nagios/eventhandlers/processmail "${MATCH}"

Postfix
Tell Postfix to use procmail by adding the the following line to /etc/postfix/main.cf (restart Postfix when finished):
mailbox_command = /usr/bin/procmail
You might want to search your main.cf file for mailbox_command to make sure procmail isn’t already configured/turned on. You also might want to do whereis procmail to make sure it’s in the /usr/bin folder. If your Nagios server hasn’t previously been configured to receive email, you’ve got some configuration to do – that’s outside of the scope of this article, but I would suggest getting that up and running first.

Perl Script
Next up is the perl script that procmail references. Create a /usr/lib/nagios/eventhandlers/processmail file and chmod 755 it – paste in the code below:

#!/usr/bin/perl

$correctpassword = 'whatever';   # more of a sanity check than a password and can be anything
$subject = "$ARGV[0]";
$now = `/bin/date +%s`;
chomp $now;
$commandfile = '/usr/local/nagios/var/rw/nagios.cmd';

if ($subject =~ /Host/ ){      # this parses the subject of your email
        ($password, $what, $junk, $junk, $junk, $junk, $junk, $host) = split(/ /, $subject);
        ($host) = ($host) =~ /(.*)\!/;
} else {
        ($foo, $bar) = split(/\//, $subject);
        ($password, $what, $junk, $junk, $junk, $junk, $junk, $host) = split(/\ /, $foo);
        ($service) = $bar =~ /^(.*) is.*$/;
}

$password =~ s/^\s+//;
$password =~ s/\s+$//;

print "$password\t$what\t$host\t$service\n";

unless ($password =~ /$correctpassword/i) {
        print "exiting...wrong password\n";
        exit 1;
}

# ack - this is where the acknowledgement happens
# you could get creative with this and pass all kinds of things via email
# a list of external commands here: http://www.nagios.org/development/apis/externalcommands/
if ($subject =~ /Host/ ) {
        $ack =
"ACKNOWLEDGE_HOST_PROBLEM;$host;1;1;1;email;email;acknowledged through email";
} else {
        $ack = "ACKNOWLEDGE_SVC_PROBLEM;$host;$service;1;1;1;email;acknowledged through email";
}

if ($what =~ /ack/i) {
        sub_print("$ack");
} else {
        print "no valid commands...exiting\n";
        exit 1;
}


sub sub_print {
        $narf=shift;
        open(F, ">$commandfile") or die "cant";
        print F "[$now] $narf\n";
        close F;
}

The script above assumes certain things about how your email subject line is formatted and you might have to tweak it if you’ve done much/any customization to the Notification commands in the default commands.cfg file. One thing you will need to change is the “Host” variable. The default is to put Host: $HOSTALIAS$ in the subject – you’ll need to replace that with $HOSTNAME$ as that is what the nagios.cmd file expects. If you don’t change that, the perl script above will pass the $HOSTALIAS$ to the nagios.cmd file and it won’t know what to do with it. Below is a sample of my notify-service-by-email command:

define command{
        command_name    notify-service-by-email
        command_line    /usr/bin/printf "%b" "***** Nagios *****\n\nNotification Type: $NOTIFICATIONTYPE$\n\nComment: $SERVICEACKCOMMENT$\n\nService: $SERVICEDESC$\nHost: $HOSTALIAS$\nAddress: $HOSTADDRESS$\nState: $SERVICESTATE$\n\nDate/Time: $LONGDATETIME$\n\nAdditional Info:\n\n$SERVICEOUTPUT$\n\nMonitoring Page: http://nagios1/nagios\n" | /bin/mail -s "** $NOTIFICATIONTYPE$ Service Alert: $HOSTNAME$/$SERVICEDESC$ is $SERVICESTATE$ **" $CONTACTEMAIL$

Example
So, when i get an alert that has a subject something like this:
** PROBLEM alert - server1/CPU Load is WARNING **
I can just reply and add “whatever ack” to the beginning of the subject line:
whatever ack RE: ** PROBLEM alert - server1/CPU Load is WARNING **
and the alert will be acknowledged.

Troubleshooting
As I said earlier, you will want to make sure Postfix is configured correctly for receiving email for the Nagios user – this might be an area where you’ll have issues if it’s not set up correctly. The other thing that fouled me up a few times was the Notification command section I mentioned above. By passing commands directly to the nagios.cmd file and by watching the log files, you should be able to spot any misconfigs.
January 4, 2010

Uptime of various web properties

Filed under: Monitoring — Nate @ 6:19 pm

Came across a post on Techcrunch, which then lead me to Alertsite, which seems to maintain a list of various web sites in various industries and their average uptime and response time. I thought it was interesting at least that Amazon is up only 97% of the time, and LinkedIn up only 95% of the time for examples. Kind of puts things in perspective I think, an increasing number of people and organizations are “demanding” higher levels of uptime, while it’s certainly achievable it seems in many cases the costs are just not worth it.  Taking it to an extreme level, this topic reminds me of this article written several years ago by our best friends at The Register.

When Microsoft goofed the DNS settings on its microsoft.com servers recently, he figured the site would have to be up for the next two hundred years to achieve five-nines uptime.

Don’t know why I remember things like that but can’t remember other things like birthdays.

September 10, 2009

Where is the serial console in ESXi

Filed under: Monitoring,Virtualization — Tags: , — Nate @ 8:28 am

Back to something more technical I suppose. I was kind of surprised and quite disappointed when vSphere was released with an ESXi that did not have serial console support. I can understand not having it in the first iteration but I think it’s been over a year since ESXi was first released and still no serial console support? I guess it shows how Microsoft-centric VMware has been(not forgetting that Windows 2003 introduced an emergency console on the serial port, though I haven’t known anyone that has used it).

Why serial console? Because it’s faster and easier to access. Most good servers have the ability to access a serial console over SSH, be it from HP, or Dell, or Rackable, probably IBM too. Last I checked Sun only supported telnet, not ssh, though that may of changed recently. A long time ago with HP iLO v1 HP allowed you to access the “VGA” console via SSH, using the remcons command, this vanished in iLO v2(unless they added it back in recently I haven’t had an iLO 2 system in about 1.5 years). If your dealing with a system that is several networks away, it is so much faster to get to the console with SSH then bouncing around with the web browser and fooling with browser plug ins to get to the VGA console.

Also serial console has the ability(in theory anyways) to log what you get on the serial console to a syslog or other kind of server(most console/terminal servers can do this) since it is all text. I haven’t yet seen a DRAC or an ILO that can do this that would be a nice feature to have.

ESX(non i) does support serial console though enabling it isn’t too straight forward, but at least it can be done.

Come on VMware for your next release of ESXi please add full serial console support, to be able to not only access the console while it’s booted but be able to install over serial console as well. Thanks in advance, not holding my breath!

August 4, 2009

1 Billion events in Splunk

Filed under: Monitoring — Nate @ 10:43 pm

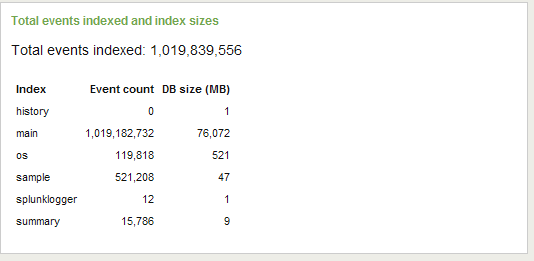
I was on a conference call with Splunk about a month or so ago, we recently bought it after using it off and on for a while. One thing that stuck out to me on that call was the engineer’s excitement around being able to show off a system that had a billion events in it. I started a fresh Splunk database in early June 2009 I think it was, and recently we passed 1 billion events. The index/DB(whatever you want to call it) just got to about 100GB(the below screenshot is a week or two old). The system is still pretty quick too. Running on a simple dual Xeon system with 8GB memory, and a software iSCSI connection to the SAN.

We have something like 400 hosts logging to it(just retired about 100 additional ones about a month ago, going to retire another 80-100 in the coming weeks as we upgrade hardware). It’s still not fully deployed right now about 99% of the data is from syslog.

Upgraded to Splunk v4 the day it came out, it has some nice improvements, filed a bug the day it came out too(well a few), but the most annoying one is I can’t login to v4 with Mozilla browsers(nobody in my company can). Only with IE. We suspect it’s some behavioral issue with our really basic Apache reverse proxy and Splunk. The support guys are looking at it still. That and both their Cisco and F5 apps do not show any data despite having millions of log events from both Cisco and F5 devices in our index. They are looking into that too.

1 billion logged events

1 billion logged events

Will it hold?

Filed under: Monitoring,Storage — Tags: , , — Nate @ 10:21 pm

I went through a pretty massive storage refresh earlier this year which cut our floorspace in half, power in half, disks in half etc. Also improved performance at the same time. It’s exceeded my expectations, more recently though I have gotten worried as far as how far will the cache+disks scale to before they run out of gas. I have plans to increase the disk count by 150% (from 200 to 300) at the end of the year, but will we last until then? My  past(admittedly limited) storage experience  says we should already be having lots of problems but we are not. The system’s architecture and large caches are absorbing the hit, the performance remains high and very responsive to the servers. How long will that hold up though?  There are thousands of metrics available to me but the one metric that is not available is cache utilization, I can get hit ratios on tons of things, but no info on how full the cache is at any particular period of time(for either NAS or SAN).

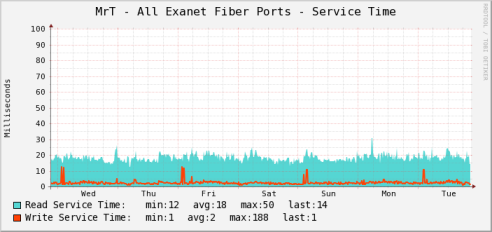
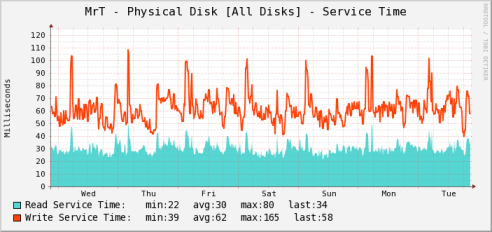
To illustrate my point, here is a graphic from my in-house monitoring showing sustained spindle response times over 60 milliseconds:

Physical Disk response time

Physical Disk response time

And yet on the front end, response times are typically 2 milliseconds:

Fiber channel response time to NAS cluster

Fiber channel response time to NAS cluster

There are spikes of course, there is a known batch job that kicks off tons of parallel writes which blows out the cache on occasion, a big gripe I have with the developers of the app and their inability to(so far) throttle their behavior. I do hold my breath on occasion when I personally witness the caches(if you add up both NAS+SAN caches it’s about 70GB of mirrored memory) getting blown out. But as you can see both on the read and especially write side the advanced controllers are absorbing a huge hit. And the trend over the past few months has been a pretty steep climb upwards as more things run on the system. My hope is things level off soon, that hasn’t happened yet.

The previous arrays I have used would not of been able to sustain this, by any stretch.

Will it hold?

Making RRD output readable

Filed under: Monitoring — Tags: , , , , — @ 8:19 pm

I have been doing a lot of work lately with creating new data points to monitor with cacti and when trouble shooting why a new data point is not working I have been running into a bit of an issue.  I can see what my script is handing to the cacti poller, I can see what cacti is putting in the RRD file (with increased logging), but I can’t easily see what RRD has done with that data before handing off to cacti.  By default RRD store’s the time stamps in Epoch Time (seconds since midnight on Jan 1st, 1970) and data in scientific notation. Now, I don’t know about you, but I can’t read either of those without some help so here is my little Ruby script helper

#!/usr/bin/env ruby
# Author: W. David Nash III
# Version 0.1
# August 3, 2009

count = 0
STDIN.each do|l|

        count += 1

        printf("%-3i | ",count)

        if !l.match(/^\d+/)
                header = l.to_s.split
        else

                (td, data) = l.split(/:/).map
                time = Time.at(td.to_i)
                printf("%s:", time.strftime("%Y-%m-%d %H:%M:%S"))

                data.to_s.split.map do |d|
                        if (d.eql? "nan") then d = "0.00" end
                        printf(" | %20.2f", d.chomp)
                end
        end

        if(count == 1)
                printf("%20s", "Time")
                header.each do |h|
                        printf(" | %20s",h)
                end
        end
        puts "\n"
end

and you use it like so

rrdtool fetch rra/.rrd AVERAGE -s -1h -r 60  | ./readRRD.rb

and here is some sample output

1   |                 Time |   Heap_Mem_Committed |         Heap_Mem_Max |        Heap_Mem_Used | Non_Heap_Mem_Commit |    Non_Heap_Mem_Init |     Non_Heap_Mem_Max |    Non_Heap_Mem_Used |             CPU_TIME |            User_Time |         Thread_Count |    Peak_Thread_Count |        Heap_Mem_Init
2   |
3   | 2009-08-03 13:18:00: |         213295104.00 |         532742144.00 |         130720632.67 |          36405248.00 |          12746752.00 |         100663296.00 |          36383328.00 |         623333333.33 |         531666666.67 |               111.33 |               184.00 |                 0.00
4   | 2009-08-03 13:19:00: |         213295104.00 |         532742144.00 |         132090801.60 |          36405248.00 |          12746752.00 |         100663296.00 |          36383328.00 |        1818000000.00 |        1704000000.00 |               111.80 |               184.00 |                 0.00
5   | 2009-08-03 13:20:00: |         213295104.00 |         532742144.00 |         122721880.67 |          36405248.00 |          12746752.00 |         100663296.00 |          36383328.00 |        2186666666.70 |        2057500000.00 |               112.92 |               184.00 |                 0.00

Powered by WordPress