So I was browsing through that little drop down address bar in Firefox hitting the sites I usually hit, and I decided hey let’s go look at what Pillar is doing. I’ve never used their stuff but I dig technology you know, so I like to try to keep tabs on companies and products that I haven’t used, and may never consider using, good to see what the competition is up to, because you never know they may come out with something good.
Tired of the thin argument
So the CEO of Pillar has a blog, and he went on a mini rant about how 3PAR^H^H^H^HHP is going around telling people you can get 100TB of capacity in one of their 70TB arrays. I haven’t read too deep into what the actual claim they are making is, but being so absolutely well versed in 3P..HP technology I can comment with confidence in what their strategy is and how they can achieve those results. Whether or not they are effective at communicating that is another story, I don’t know because well I don’t read everything they say.
Pillar notes that HP is saying that due to the 3PAR technologies you can get by with less and he’s tired of hearing that old story over and over.
Forget about thin for the moment!
So let me spray paint another angle for everyone to see. As you know I do follow SPC-1 numbers pretty carefully. Again not that I really use them to make decisions, I just find the numbers and disclosure behind them very interesting and entertaining at times. It is “fun” to see what others can do with their stuff in a way that can be compared on a level playing field.
I wrote, what I consider a good article on SPC-1 benchmarks a while back, EMC gave me some flak because they don’t believe SPC-1 is a valid test, when I believe EMC just doesn’t like the disclosure requirements, but I’m sure you won’t ever hear EMC say that.
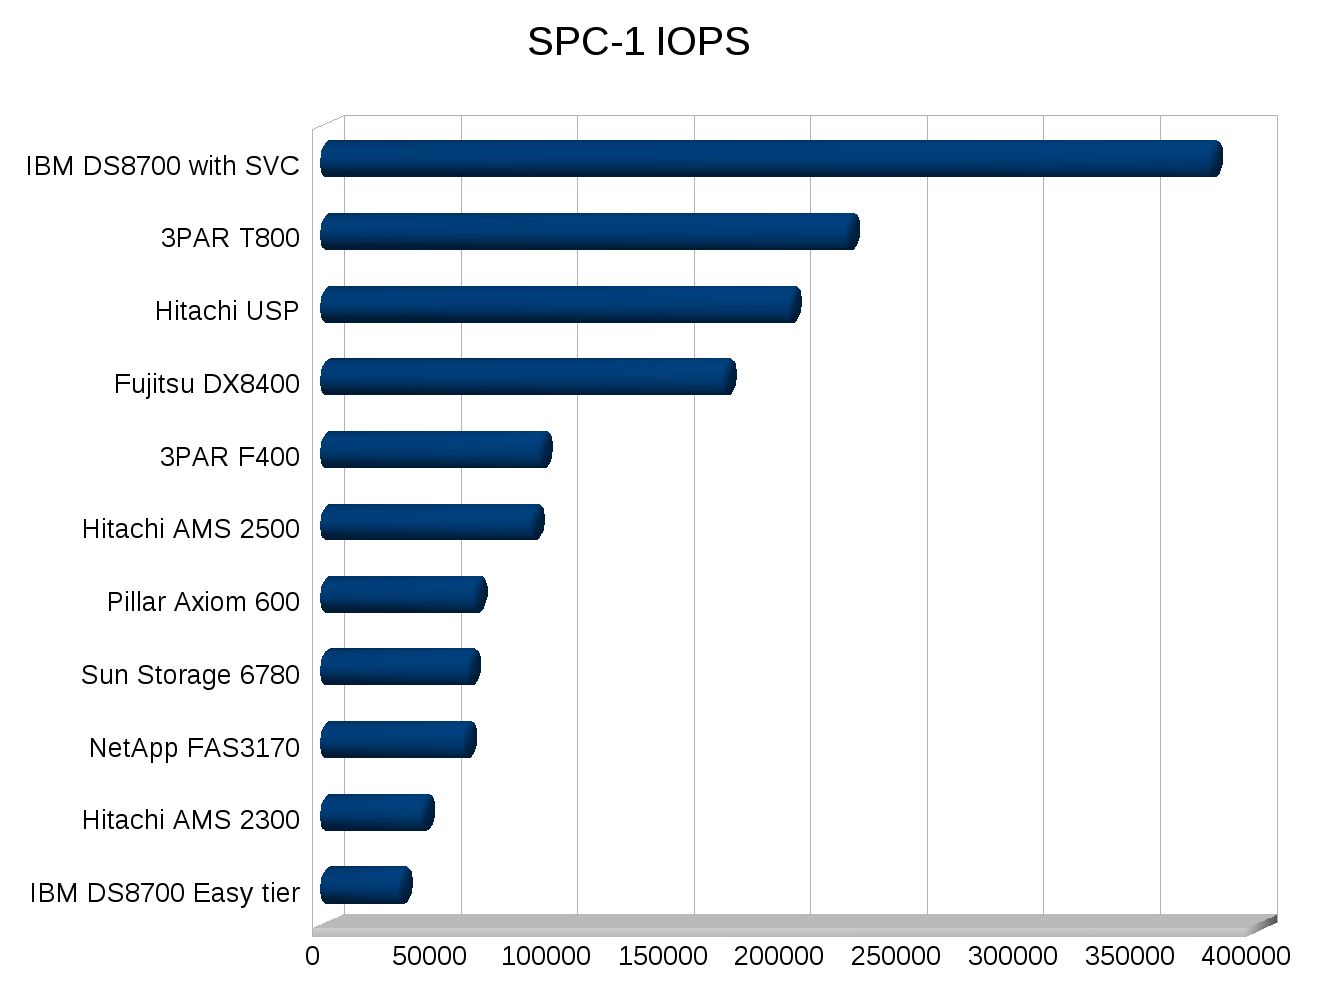
SPC-1 Results
So let’s take the one and only number that Pillar published, because, well that’s all I have to go on, I have no personal experience with their stuff, and don’t know anyone that uses it. So if this information is wrong it’s wrong because the results they submitted were wrong.
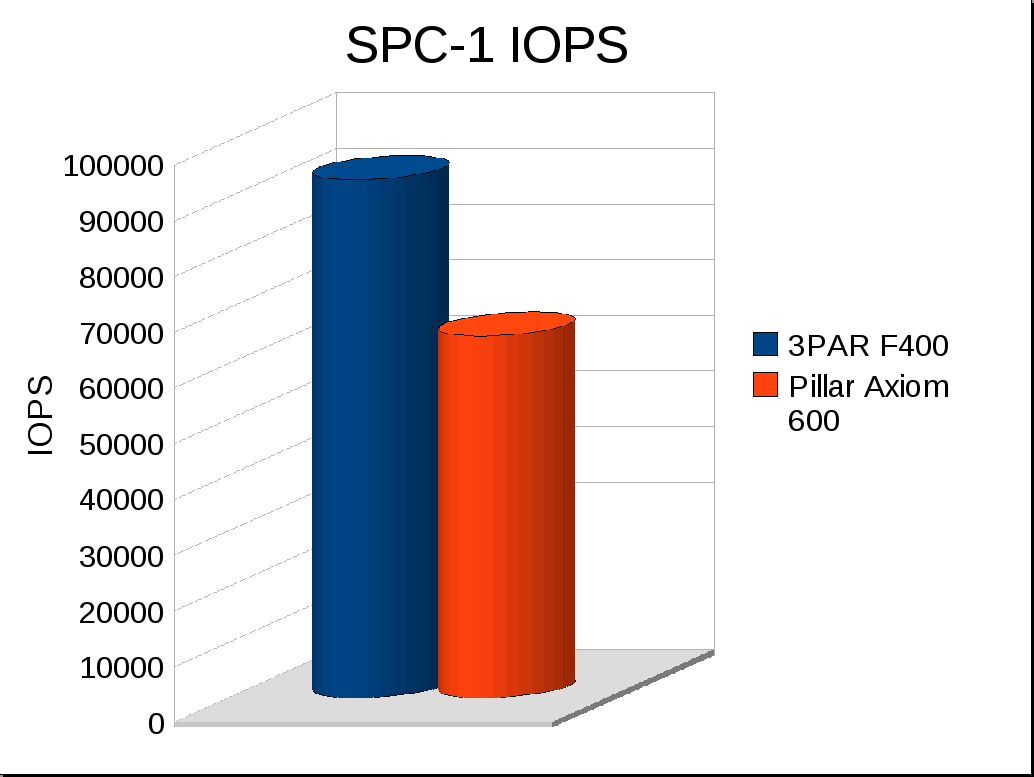
So, the Pillar Axiom 600‘s results have not stood the test of time well at all, as you would of noticed in my original article, but to highlight:
- System tested: January 12, 2009
- SPC-1 IOPS performance: 64,992
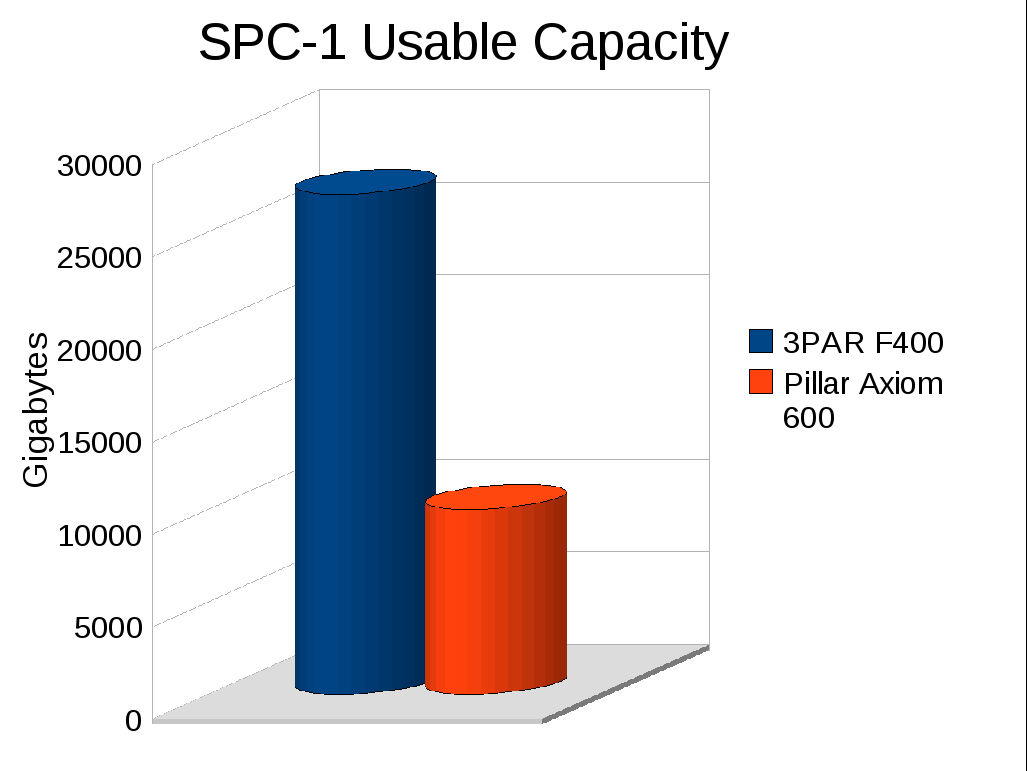
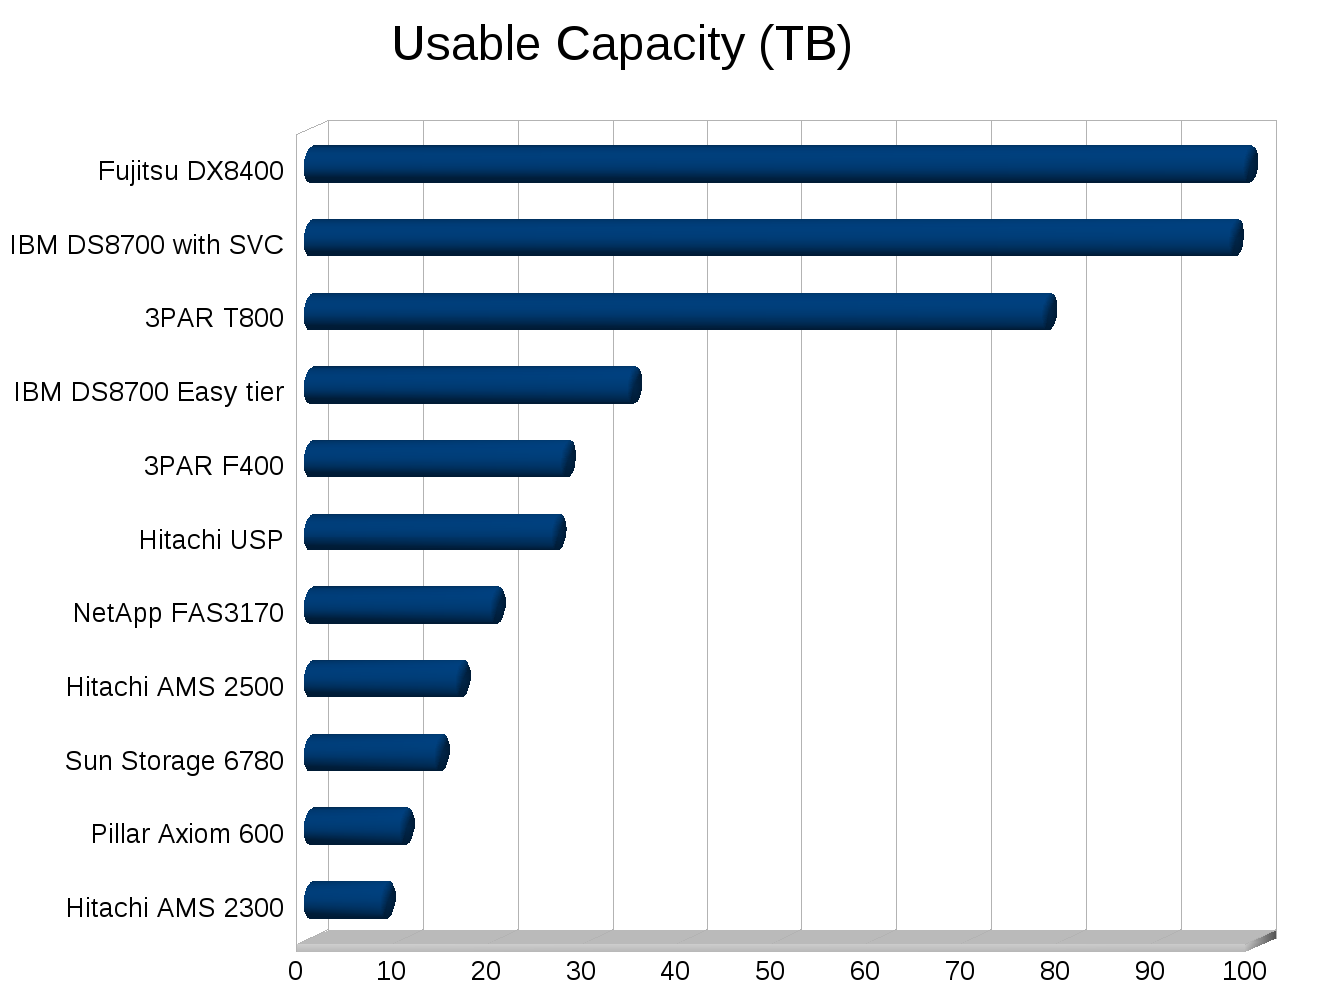
- SPC-1 Usable space: 10TB
- Disks used: 288 x 146G 15k RAID 1
- IOPS per disk: 226 IOPS/disk
- Average Latency at peak load: 20.92ms
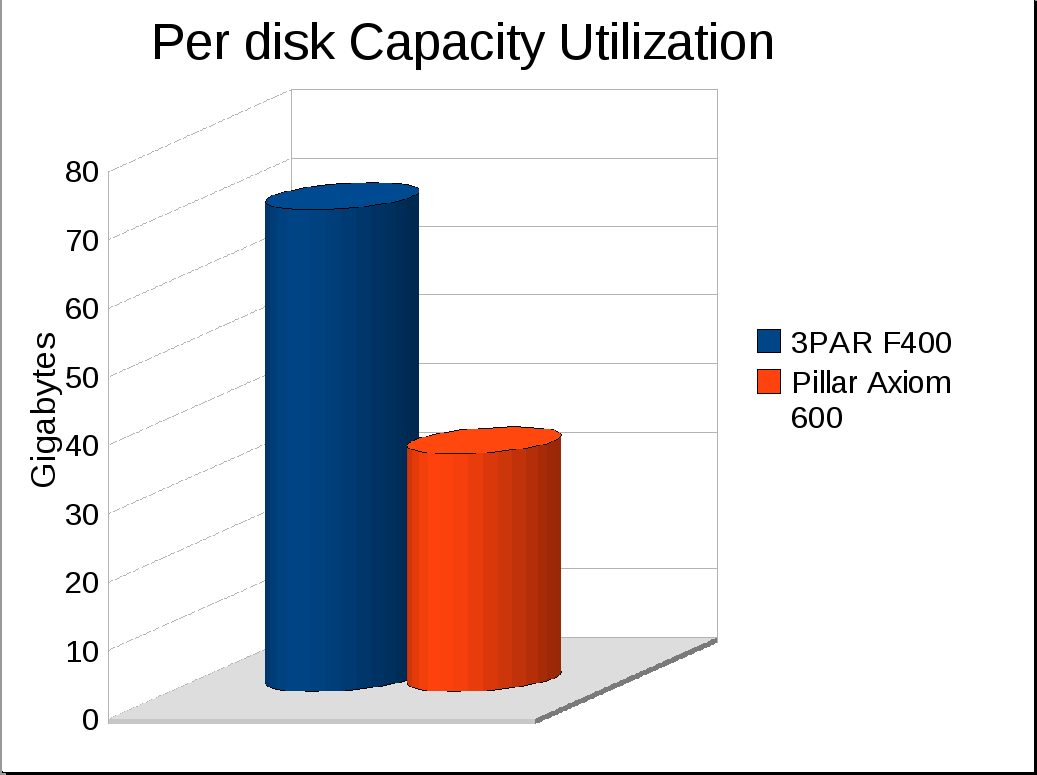
- Capacity Utilization (my own metric I just thought of): 34.72 GB/disk
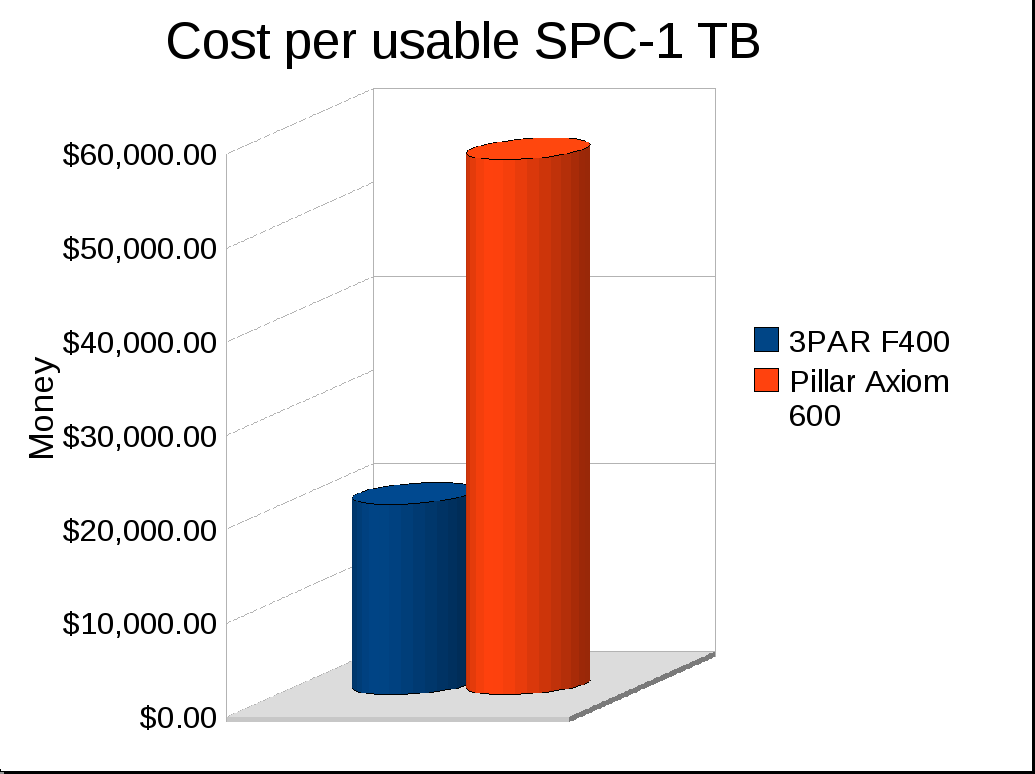
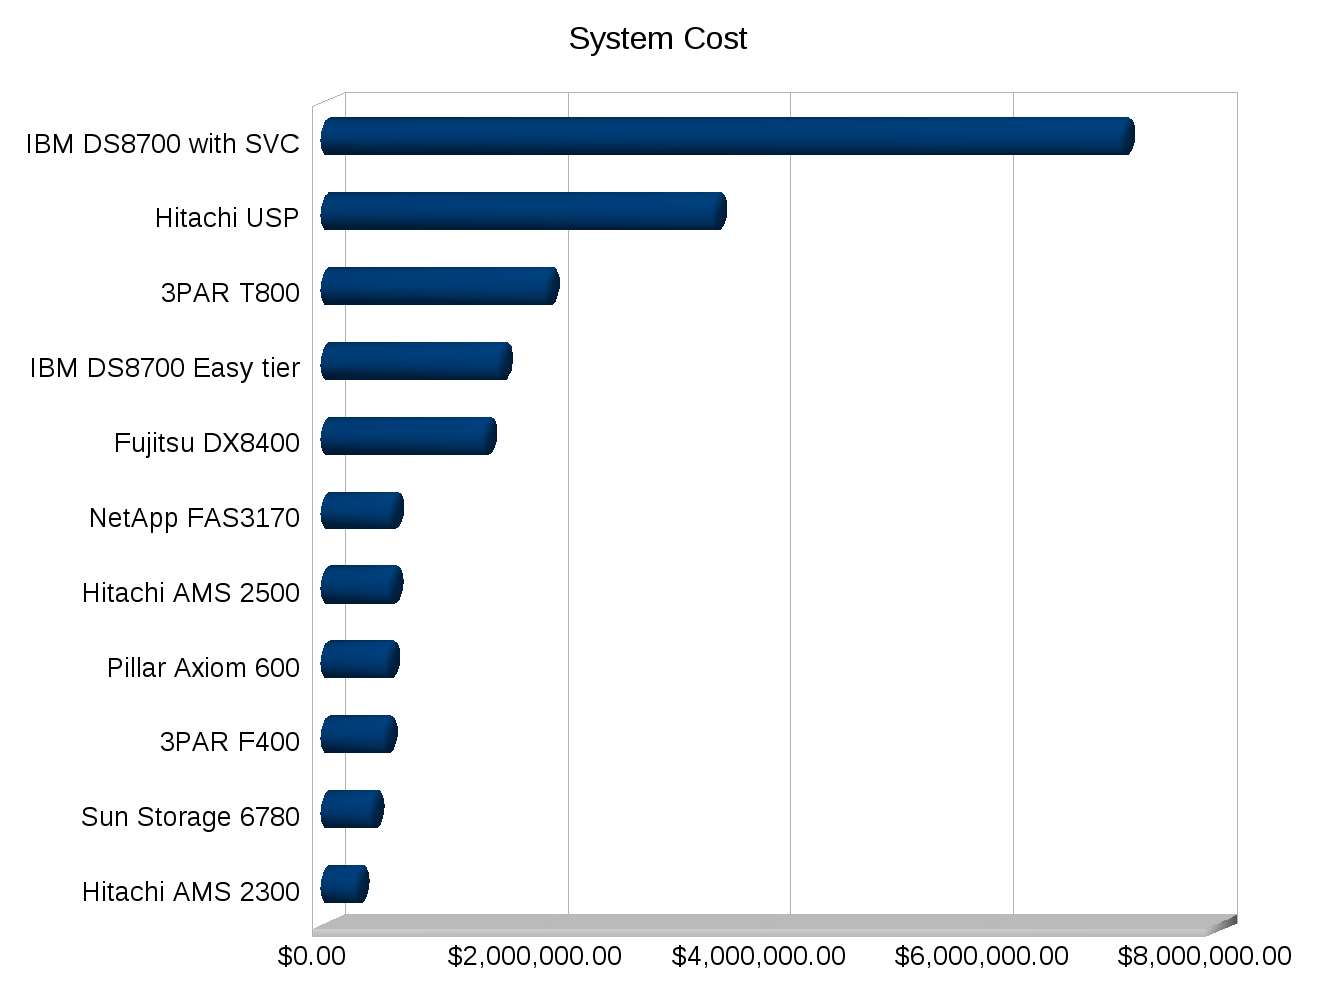
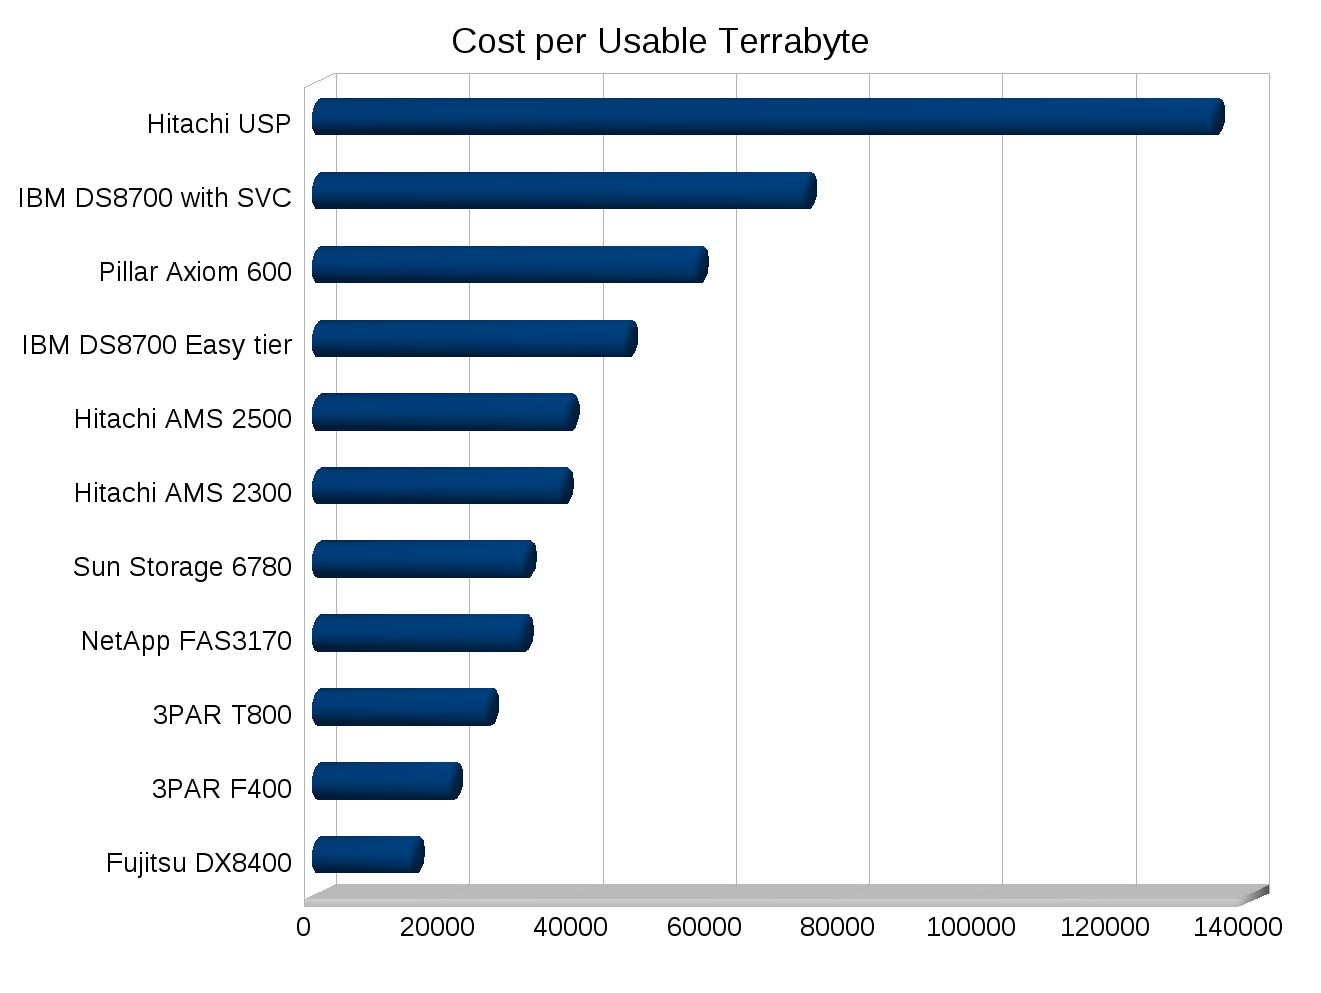
- Cost per usable TB (my own metric extrapolated from SPC-1): $57,097 per TB
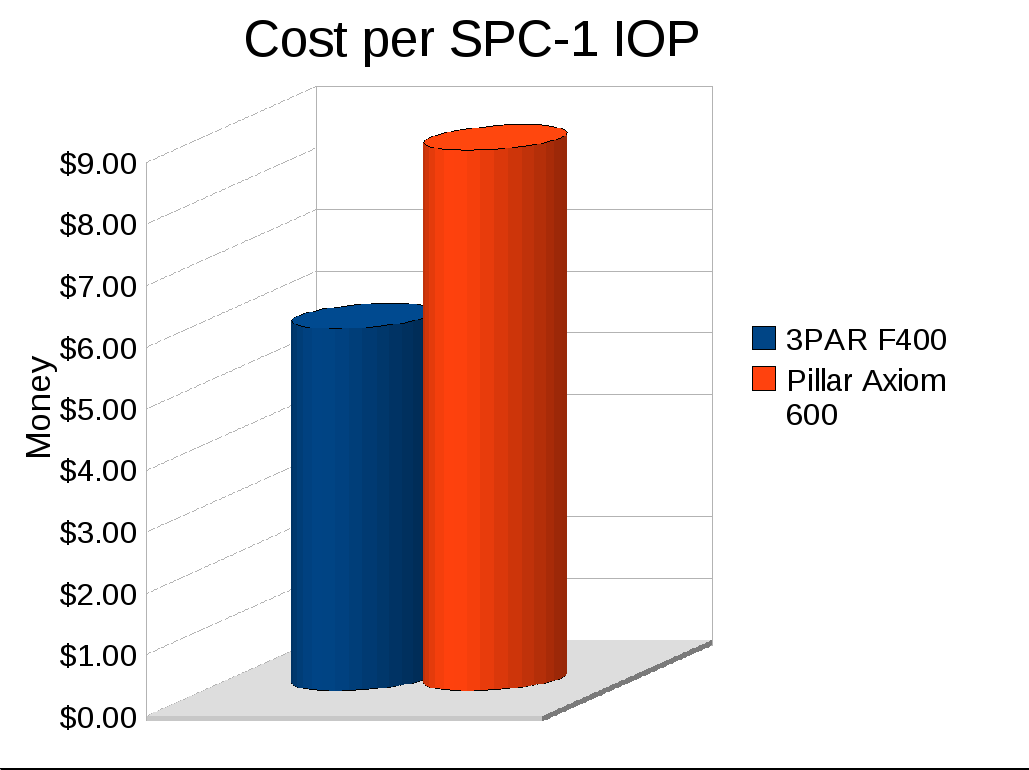
- Cost per IOP (SPC-1 publishes this): $8.79
The 3PAR F400 by contrast was tested just 105 days later and absolutely destroyed the Pillar numbers, and unlike the Pillar numbers the F400 has held up very well against the test of time all the way to present day even:
- System tested: April 27, 2009
- SPC-1 IOPS performance: 93,050
- SPC-1 Usable space: 27 TB
- Disks used: 384 x 146G 15k RAID 1
- IOPS per disk: 242 IOPS/disk
- Average Latency at peak load: 8.85ms
- Capacity Utilization: 70.432 GB/disk
- Cost per usable TB: $20,312 per TB
- Cost per IOP: $5.89
Controller Capacity
Now in my original post I indicated stark differences in some configurations that tested substantially less physical disks than the controllers supported, there are a couple of possibilities I can think of for this:
- The people running the test didn’t have enough disks to test (less likely)
- The controllers on the system couldn’t scale beyond the configuration tested, so to illustrate the best bang for your $ they tested with the optimal number of spindles to maximize performance (more likely)
So in Pillar’s case I think the latter is the case as they tested with a pretty small fraction of what their system is advertised as being capable of supporting.
Efficiency
So taking that into account, the 3PAR gives you 27TB of usable capacity, note here we aren’t even taking into account the thin technologies, just throw those out the window for a moment, let’s simplify this.
The Pillar system gives you 10TB of usable capacity, the 3PAR system gives you about 270% more space and 130% more performance for less money.
What would a Pillar system look like(or Systems I guess I should say since we need more than one) that could give us 27TB usable capacity and 93,000 SPC-1 IOPS using 146G 15k RPM disks (again trying to keep level playing field here)?
Well I can only really guess, to reach the same level of performance Pillar would need an extra 124 disks, so 412 spindles. Maintaining the same level of short stroking that they are doing(34.7GB/disk), those extra 124 spindles only get you to roughly 14.3TB.
And I’m assuming here because my comments earlier about optimal number of disks to achieve performance, if you wanted to get those extra 124 spindles in you need a 2nd Axiom 600, and all the costs with the extra controllers and stuff. Controllers obviously carry a hefty premium over the disk drives. While the costs are published in Pillar’s results I don’t want to spend the time to try to extrapolate that angle.
And if you do in fact need more controllers, the system was tested with two controllers, if you have to go to four (tested 3PAR F400 has four), 3PAR has another advantage completely unrelated to SPC-1, the ability to maintain performance levels under degraded conditions (controller failure, software upgrade, whatever) with Persistent Cache. Run your same SPC-1 test, and yank a controller out from each system (3PAR and Pillar) and see what the results are. The numbers would be even more embarrassingly in 3PAR’s favor thanks to their architecture and this key caching feature. Unlike most of 3PAR’s feature add-ons, this one comes at no cost to the customer, the only requirement is you must have at least 4 controllers on the box.
So you still need to get to 27 TB of usable capacity. From here it can get really fuzzy because you need to add enough spindles to get that high but then you need to adjust the level of short stroking your doing to use more of the space per drive, it wouldn’t surprise me if this wasn’t even possible on the Pillar system(not sure if any system can do it really, but I don’t know).
If Pillar can’t adjust the size of the short stroking then the numbers are easy, at 34.7GB/disk they need 778 drives to get to 27TB of usable capacity, roughly double what 3PAR has.
Of course the performance of a two-system based Axiom 600 with 778 drives will likely outperform a 384-disk F400(I should hope so at least), but you see where I’m going.
I’m sure Pillar engineers could come up with a way to configure the system more optimally my 778 drive solution is crazy but from a math perspective it’s the easiest and quickest thing I could come up with, with the data I have available to me.
This is also a good illustration why when I go looking at what Xiotech posts, I really can’t compare them against 3PAR or anybody else, because they only submit results for ~16 drive systems. To me, it is not valid to compare a ~16 drive system to something that has hundreds of drives and try to extrapolate results. Xiotech really does give stellar results as far as capacity utilization and IOPS/disk and stuff, but they haven’t yet demonstrated that those numbers are scalable beyond a single ISE enclosure – yet alone to several hundred disks.
I also believe the 3PAR T800 results could be better too, the person at 3PAR who was responsible for running the test was new to the company at the time and the way he laid out the system was, odd to say the least. The commands he used were even depreciated. But 3PAR isn’t all that interested in re-testing, they’re still the record holder for spinning rust in a single system(more than two years running now no doubt!).
Better response times to boot
You can see the 3PAR system performs with less than half the amount of latency that the Pillar system does despite the Pillar system short stroking their disks. Distributed RAID with full mesh architecture at work baby. I didn’t even mention it but the Pillar system has double the cache than than the F400. I mean the comparison really almost isn’t fair.
I’m sure Pillar has bigger and better things out now since they released the SPC-1 numbers for the Axiom, so this post has the obvious caveat that I am reporting based on what is published. They’d need to pull more than a rabbit out of a hat to make up these massive gaps though I think.
Another Angle
We could look at this another way as well, assuming for simplicity’s sake for a moment that both systems scale lineally up or down, we can configure a 3PAR F400 with the same performance specs as the Pillar that was tested.
You’d need 268 disks on the 3PAR F400 to match the performance of the Pillar system. With those 268 disks you’d get 18.4 TB of usable space, same performance, fewer disks, and 184% additional usable capacity. And scaling the cost down like we scaled the performance down, the cost would drop to roughly $374,000, a full $200,000 less than Pillar for the same performance and more space.
Conclusion
So hopefully this answers the question with more clarity why you can get less storage from the 3PAR F400 and get the same or better performance and usable capacity than going with a Pillar Axiom 600. At the end of the day 3PAR drives higher capacity utilization and delivers superior results for significantly less greenbacks. And I didn’t even take 3PAR’s thin technologies into account, the math there can become even more fuzzy depending on the customer’s actual requirements and how well they can leverage thin built in.
You may be able to understand why HP was willing to go to the end of the earth to acquire 3PAR technology. And you may be able to understand why I am so drawn to that very same technology. And here I’m just talking about performance. Something that unlike other things(ease of use etc) is really easy to put hard numbers on.
The numbers are pretty simple to understand, and you can see why the big cheese at HP responsible for spear heading the 3PAR purchase said:
The thin provisioning, automatic storage tiering, multi-tenancy, shared-memory architecture, and built-in workload management and load balancing in the 3PAR arrays are years ahead of the competition, according to Donatelli, and therefore justify the $2.4bn the company paid to acquire 3PAR in a bidding war with rival Dell.
Maybe if I’m lucky I can trigger interest in The Register again by starting a blog war or something and make tech news! woohoo! that would be cool. Of course now that I said that it probably won’t happen.
I’m told by people who know the Pillar CEO he is “raw”, much like me. so it will be interesting to see the response. I think the best thing they can do is post new SPC-1 numbers with whatever the latest technology they have is, preferably on 146G 15k disks!
Side note
It was in fact my 3PAR rep that inspired me to write about this SPC-1 stuff, I was having a conversation with him earlier in the year where he didn’t think the F400 was as competitive against the HDS AMS2500 as he felt it needed to be. I pointed out to him that despite the AMS2500 having similar SPC-1 IOPS and similar cost, the F400 offered almost twice the usable capacity. And the cost per usable TB was far higher on the 2500. He didn’t realize this. I did see this angle so felt the need to illustrate it. Hence my Cost per SPC-1 Usable TB. It’s not a performance metric, but in my opinion from a cost perspective a very essential metric, at least for highly efficient systems.
(In case it wasn’t obvious, I am by no means compensated by 3PAR in any way for anything I write, I have a deep passion for technology and they have some really amazing technology, and they make it easy to use and cost effective to boot)
