There are two main storage benchmarks I pay attention to:
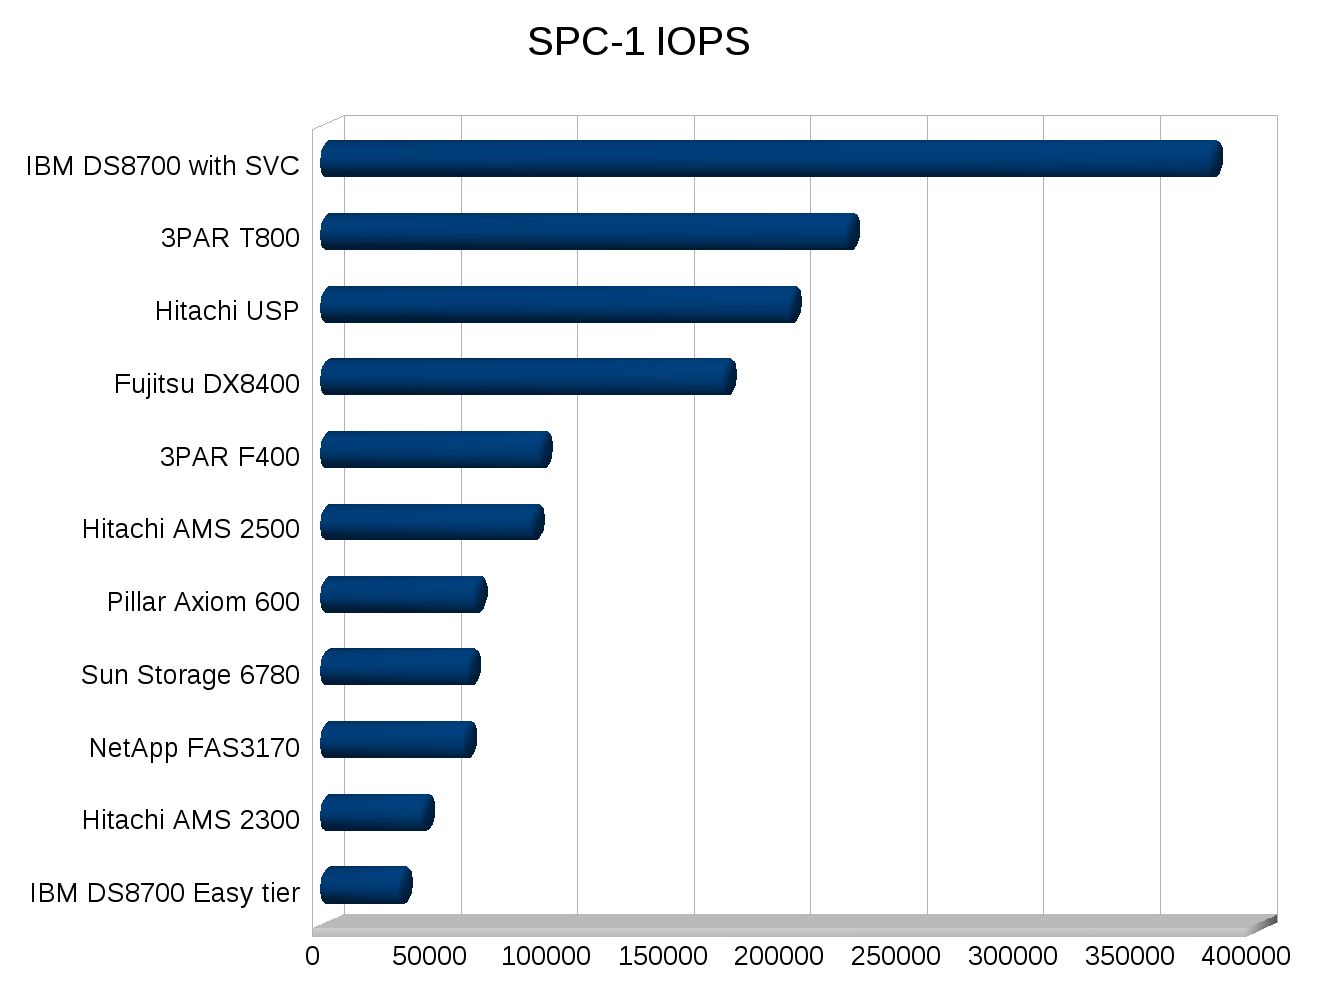
- SPC-1 – Storage Performance Council’s IOPS test based on simulated OLTP database load.
- SPECsfs2008_nfs.v3 – SPEC’s NFS IOPS benchmark
Of course benchmarks are far from perfect, but they can provide a good starting point when determining what type of system you need to look towards based on your performance needs. Bringing in everything under the sun to test in house is a lot of work, much of it can be avoided by getting some reasonable expectations up front. Both of these benchmarks do a pretty good job. And it’s really nice to have the database of performance results for easy comparison. There’s tons of other benchmarks that can be used but very few have a good set of results you can check against.
SPC-1 is better as a process primarily because it forces the vendor to disclose the cost of the configuration and 3 years of support. They could improve on this further by forcing the vendor to provide updating pricing to the configuration for 3 years, while the performance of the configuration should not change(given the same components), the price certainly should decline over time so the cost aspects become harder to compare the further apart the tests(duh).
SPC-1 also forces full disclosure of everything required to configure the system, down to the CLI commands to configure the storage. You can get a good idea on how simple or complex the system is by looking at this information.
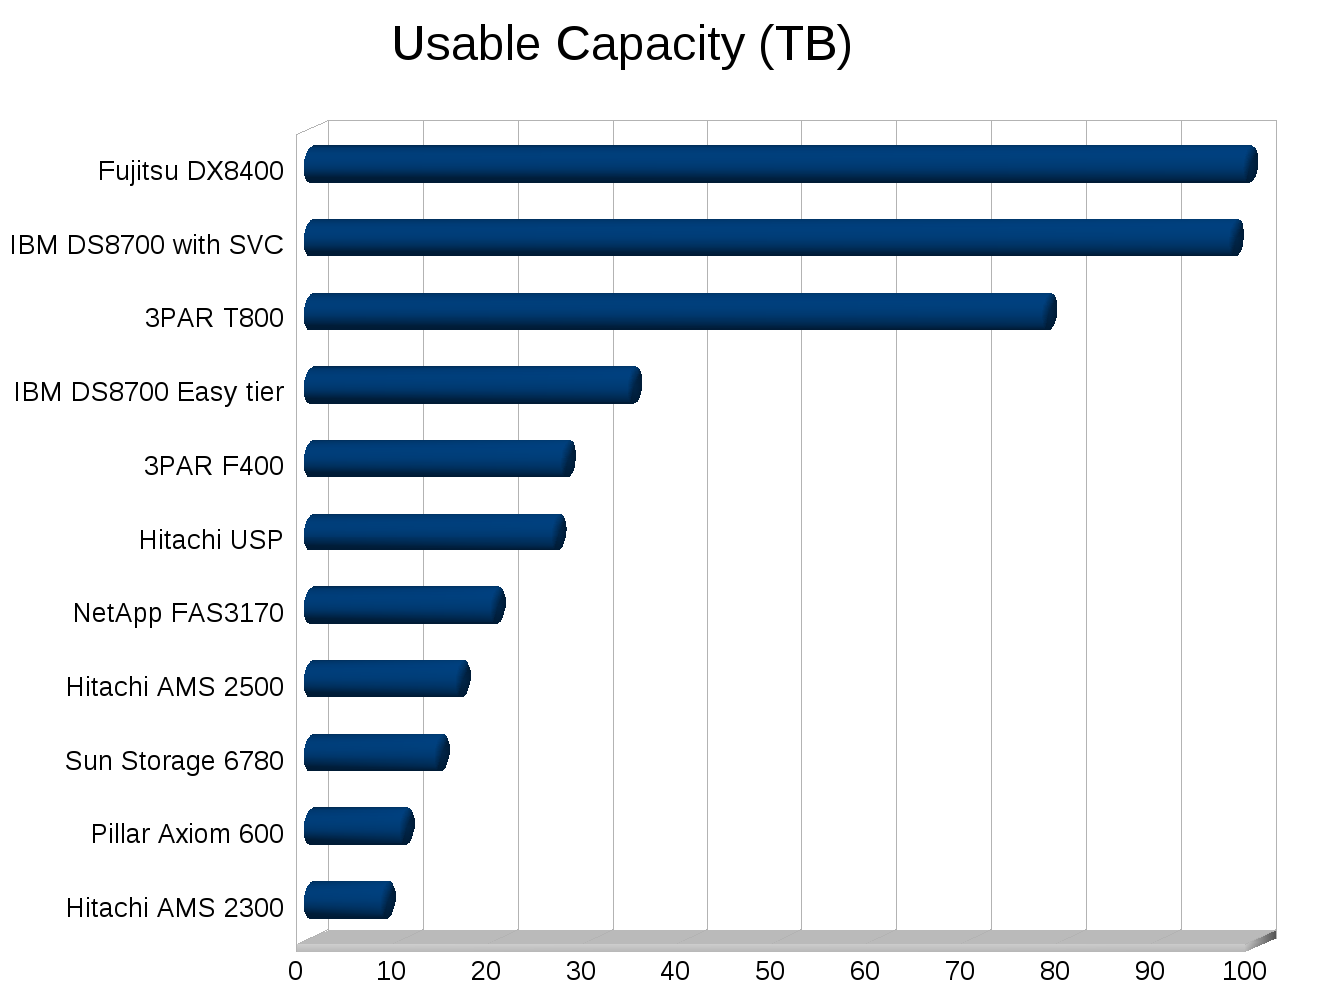
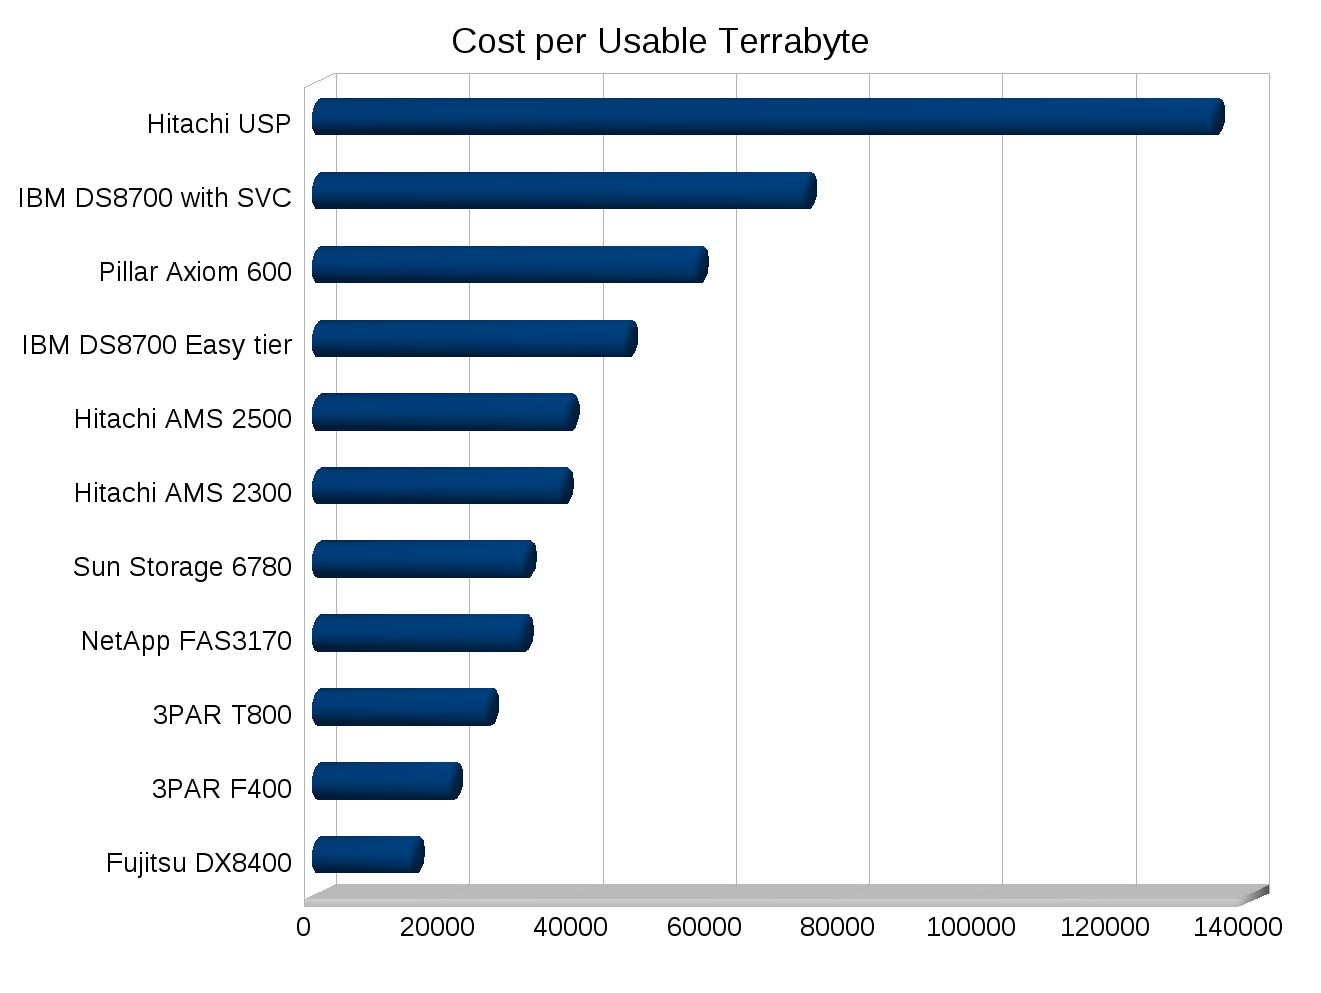
SPC-1 doesn’t have a specific disclosure field for Cost per Usable TB. But it is easy enough to extrapolate from the other numbers in the reports, it would be nice if this was called out(well nice for some vendors, not so much for others). Cost per usable TB can really make systems that utilize short stroking to get performance stand out like a sore thumb. Another metric that would be interesting would be Watts per IOP and Watts per usable TB. The SPC-1E test reports Watts per IOP, though I have hard time telling whether or not the power usage is taken at max load, seems to indicate power usage was calculated at 80% load.
Storage performance is by no means the only aspect you need to consider when getting a new array, but it usually is in at least the top 5.
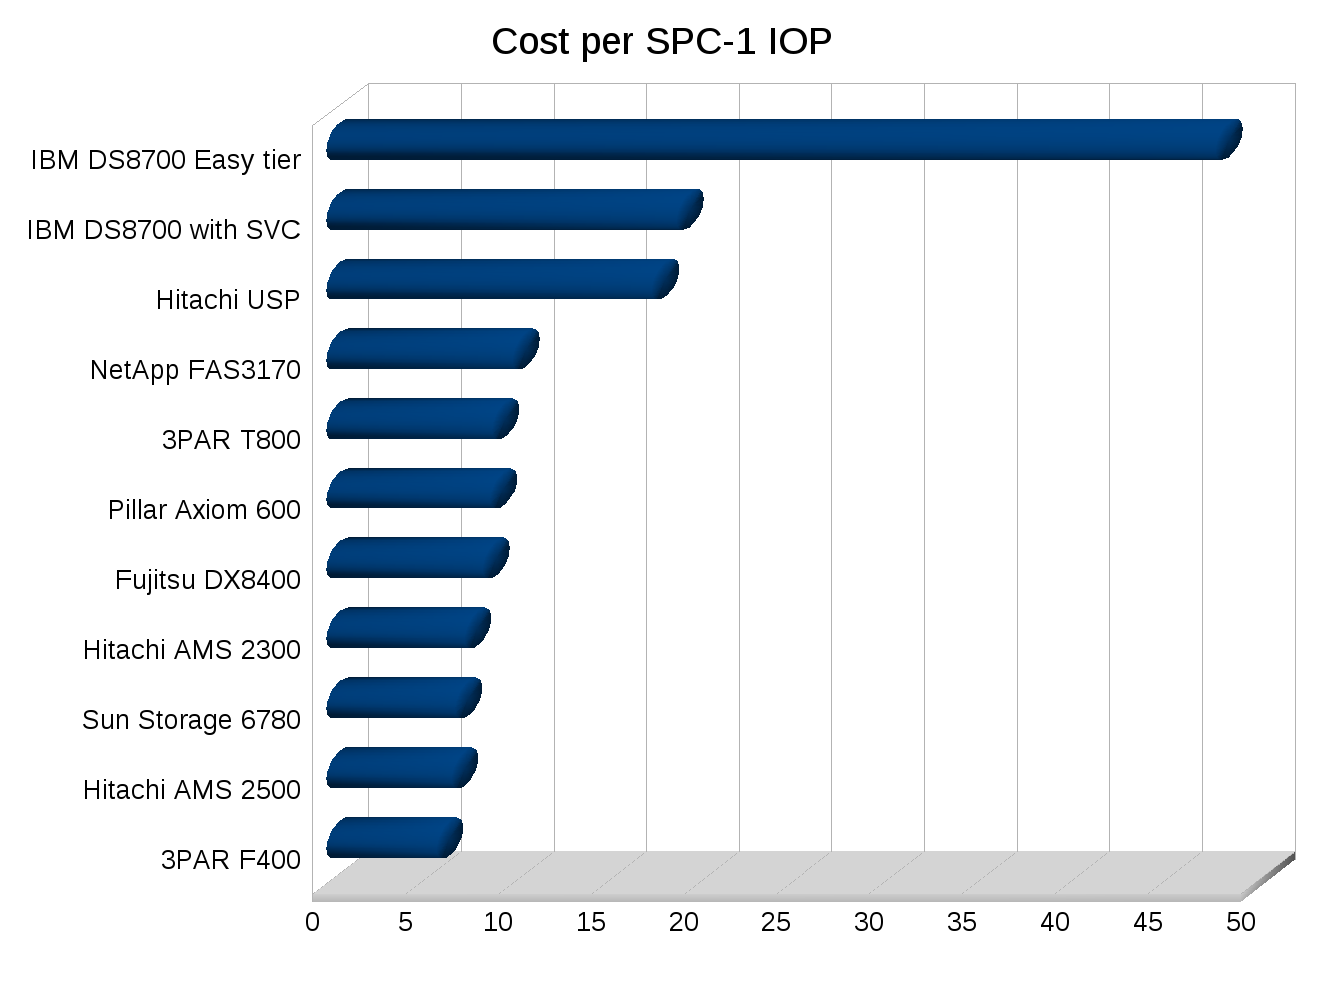
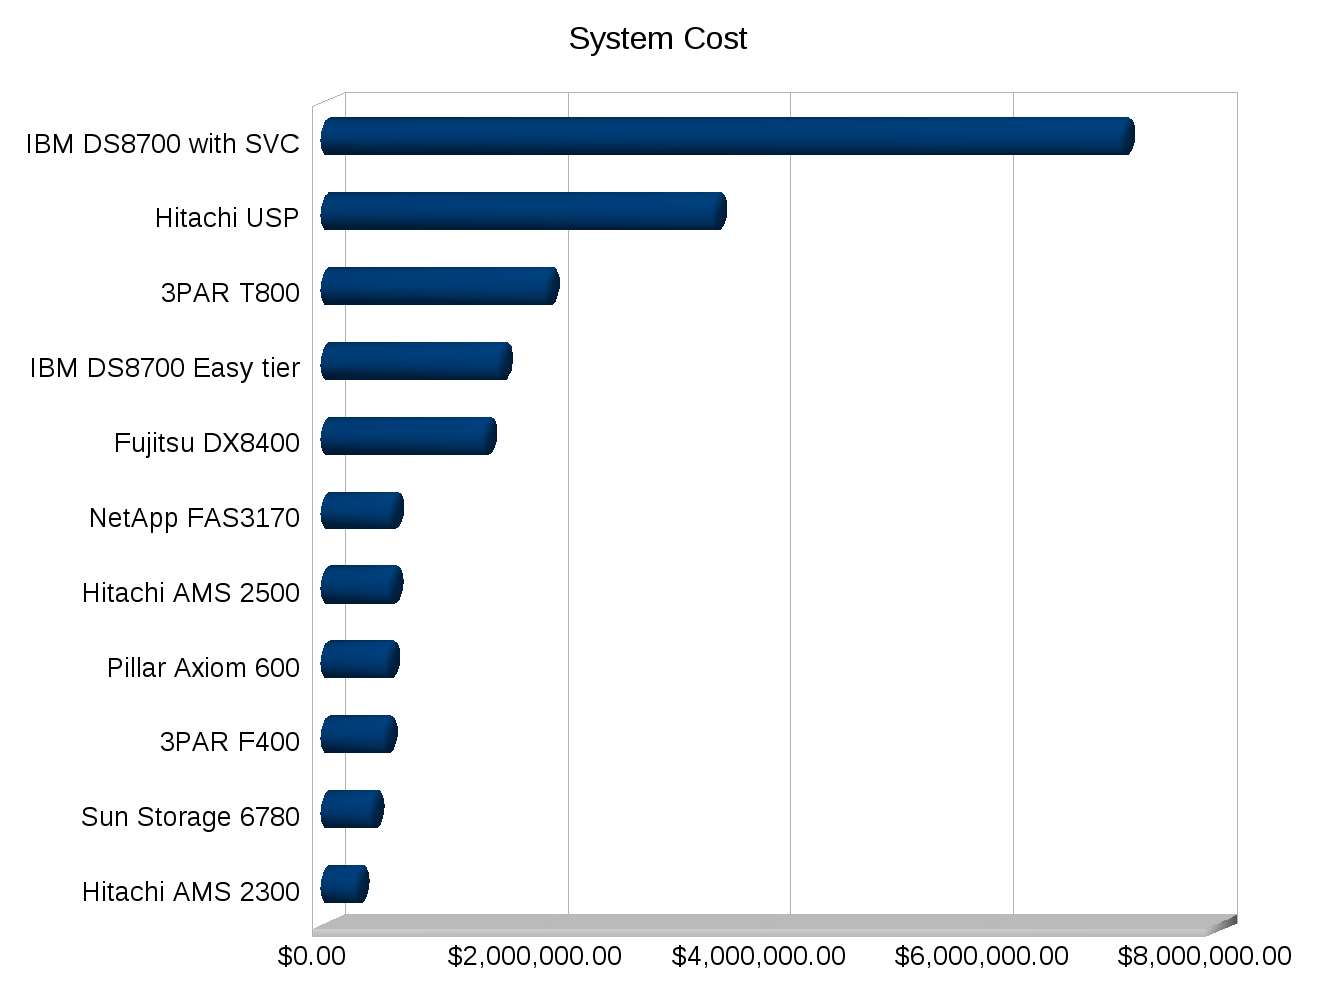
I made a few graphs for some SPC-1 numbers, note the cost numbers need to be taken with a few grains of salt of course depending on how close the systems were tested, the USP for example was tested in 2007. But you can see trends at least.
The majority of the systems tested used 146GB 15k RPM disks.
Somewhat odd configurations:
- From IBM, the easy tier config is the only one that uses SSD+SATA, and the other IBM system is using their SAN Volume Controller in a clustered configuration with two storage arrays behind it (two thousand spindles).
- Fujitsu is short stroking 300GB disks.
- NetApp is using RAID 6 (except IBM’s SSDs everyone else is RAID 1)
I’ve never been good with spreadsheets or anything so I’m sure I could make these better, but they’ll do for now.
Links to results:
- 3PAR F400 – Tested 4/27/2009
- 3PAR T800 – Tested 9/02/2008
- Fujitsu DX8400 – Tested 5/25/2010
- Hitachi AMS 2300 – Tested 3/24/2009
- Hitachi AMS 2500 – Tested 3/24/2009
- Hitachi USP – Tested 10/01/2007
- IBM DS8700 Easy Tier – Tested 4/13/2010
- IBM DS8700 with SVC – Tested 2/01/2010
- NetApp FAS3170 – Tested 6/10/2008
- Pillar Axiom 600 – Tested 1/13/2009
- Sun Storage 6780 – Tested 6/01/2010
In teh 3Par t800 test, the above graph shows around 1250 drives, but the document show a configuration with 640 drives. Am I missing something?
Comment by Mike Hardy — June 18, 2010 @ 2:22 pm
You might be yes, from the configuration at the bottom of the page it reads
1280 – 146 GB, 15K RPM disk drives
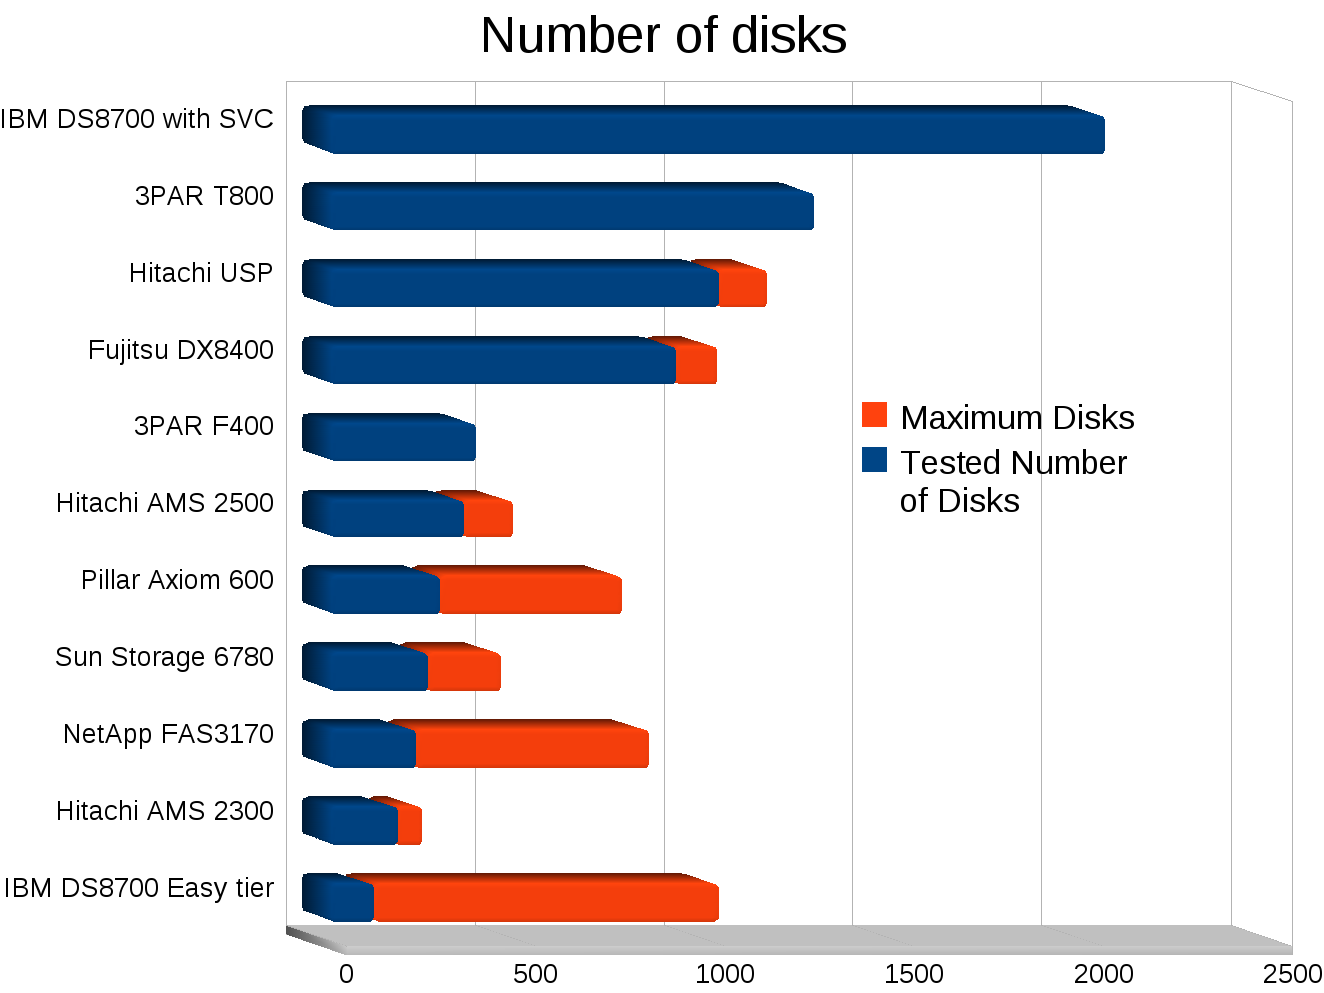
One interesting thing to note is the max # of drives supported by the array vs the number of drives tested. Some vendors are vastly under populating their arrays indicating that the controllers are the bottleneck.
Comment by Nate — June 18, 2010 @ 2:47 pm
I’ll add another chart this weekend or something that shows that, it’s an interesting angle.
Comment by Nate — June 18, 2010 @ 2:56 pm
Can you please do another graph. Number of disks per IOPS. And number of disk per total cost of the solution. You might be surprise to see smaller config outperform huge one.
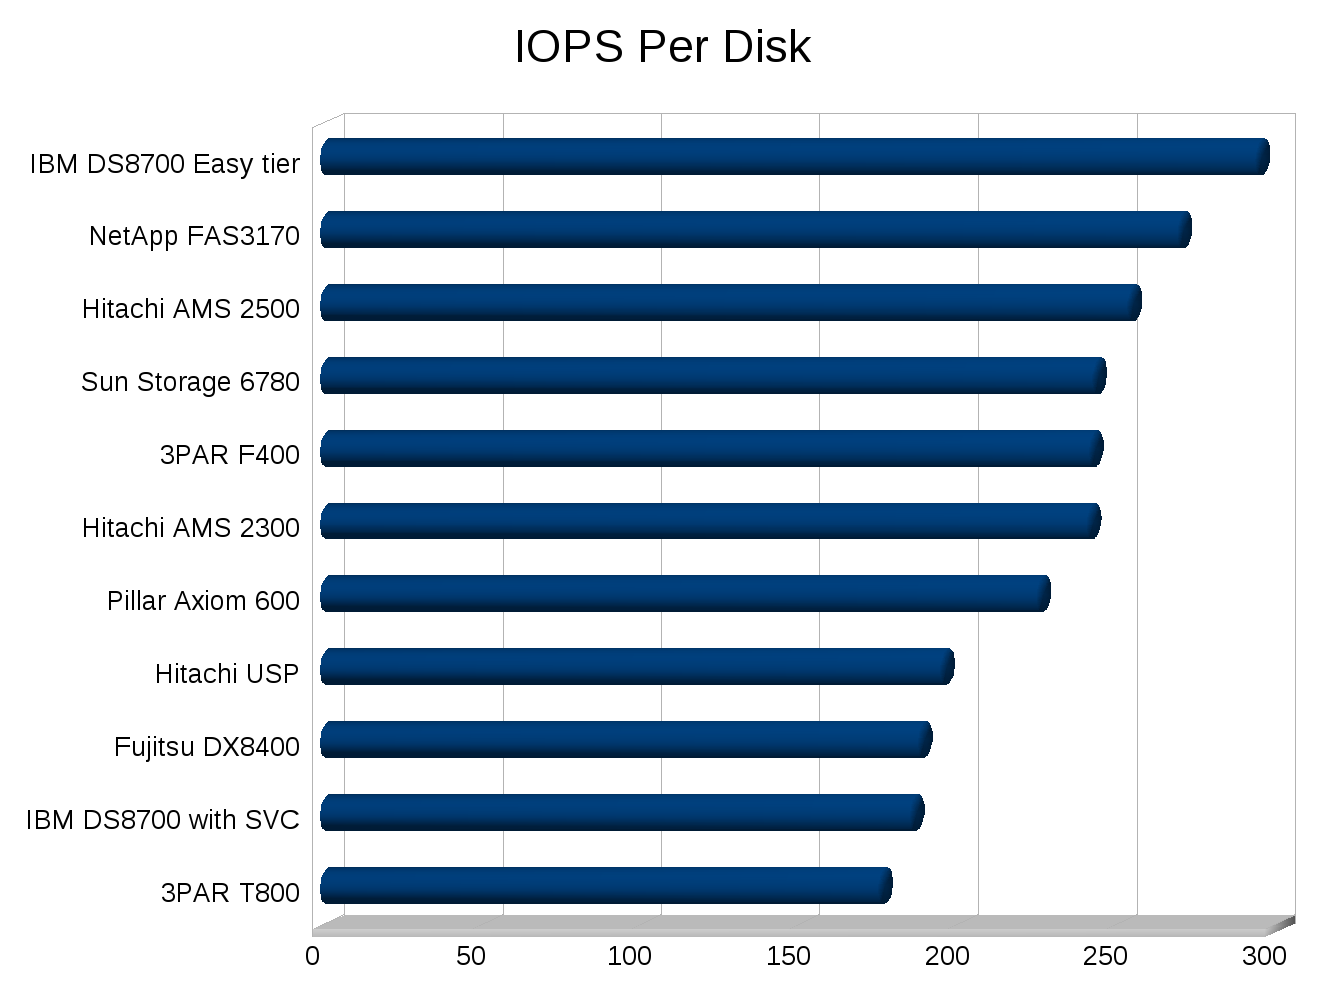
Bottom line, in IOPS you cannot go faster than disk IOPS. My rule of thumb is 200IOPS per disk no matter what capacity or storage controller you have.
SPC do not represent reality. The benchmark do not assume “real” SAN configuration. Look at the number of hosts connected during the tests. One or two. In practical world we have up to hundreds of them with various workload and not just one type.
In my world they is no such thing of sequential. Everything is random considering all severs activities on the array. Same is true for SPC-2. No one have SAN with one type of workload for the entire array.
My 2 cents!
Comment by Visiotech — June 18, 2010 @ 6:00 pm
SPC-1 is random I/O. If you know of a better benchmark then let me know! Ideally something that has a lot of published results, SPC-1 certainly is not perfect, but I’ve yet to come across anything more complete.
I updated the # of disks graph.
The main point of this article was about the more scalable arrays rather than the smaller ones, say minimum of 100 disks? If the system can’t scale then, well that’s a whole other can of worms 🙂
Take IBM XIV for example, very nice software feature set, but doesn’t go beyond 180 drives, really limits it’s use cases. Since it’s an IBM, expand support to 1000 drives and it sounds like a nice system. Though the core architecture of the system as-is prevents that, which is why they are limited to 180.
Comment by Nate — June 18, 2010 @ 6:11 pm
I think you meant # of IOPS per disk so I added a chart for that now too.
Comment by Nate — June 19, 2010 @ 6:53 am
“SPC-1 is not perfect” – understatement of the century.
“I’ve yet to come across anything more complete” – huh?
Since when is “the only available data” accepted as accurate or valid?
BP told the world their well was only leaking 3-5000 barrels a day. We know know that the amount was AT LEAST 10 times that amount, and perhaps even more than 20.
It is not easy to build a fair, accurate and representative benchmark – that I will not argue. But when people start accepting a benchmark as fact solely because it is all they have – well, that’s a travesty of logic.
Perhaps we’re already seeing the negative implications of “teaching to the test” that is so rampant in our schools…logics, analytics and the scientific method seem to be abandoned – replaced by meaningless data in pretty bar charts.
(No insult intended, but the derived charts only serve to further obfuscate the fact that the SPC benchmarks bear no definitive relationship to ANY real-world use case – and “random workload” is anything but definitive).
Comment by the storage anarchist — June 23, 2010 @ 4:12 am
Well it provides a better starting point than going entirely blind. Given that no storage vendor publishes publically available performance information, unlike the server and networking world. Bringing in every system under the sun to put it under your own “real world” tests is even less realistic then relying on benchmarks as a starting guide(for the performance aspect).
I find the SPC-1 numbers to be very helpful. Same for SPEC SFS. It provides common ground and full disclosure. It didn’t help me during my last array purchase since I already knew what I needed to know.
I recall one vendor a couple of years ago touting their IOPS performance and the numbers they were talking about were clearly from cache, not from disk, but those were the only numbers they would give (few months later they posted SPC-1 numbers). I don’t mind cache numbers but really do want full disclosure, in any situation.
thanks for reading!
Comment by Nate — June 23, 2010 @ 7:34 am
@anarchist. For a company that doesn’t publish the benchmark you’ve a lot of comments. First publish and then post. BTW we’ve dmx and t400 and the dmx performance with fc r1 sucks wind even against sat r5 per.
Comment by IndianRepublican — June 24, 2010 @ 6:06 pm
Interesting graphs, but… SPC-1 is a performance benchmark. It makes no sense to look at “cost per usable terabyte.” It appears that some vendors have skewed this metric by creating large LUNs.
I’m thinking here that a better metric might by “Watts per IO” and “BTUs per IO”, if that information was available. Hopefully soon we’ll see companies submitting results to the SPC-1/E.
One interesting little tidbit I noticed about the AMS 2500. The system was configured without any spares. That’s definitely not a real world configuration. There’s probably more examples of that kind of stuff but I don’t have time to look through all the listed SPC results.
And one final note on your comment that “some vendors are vastly under populating their arrays indicating that the controllers are the bottleneck.” I think cost is the more likely factor, not controller bottlenecks! The vendor has to cover the cost of the test system, and some vendors, even large ones like Hitachi, are not going to be able to put all necessary resources towards a fully-maxed system. Sometimes those lab drives are just too valuable!
Comment by Packet Racer — June 28, 2010 @ 3:31 am
[…] Maybe they are worried they might end up like Pillar, who’s CEO was pretty happy with their SPC-1 results. Shortly afterwards the 3PAR F400 launched and absolutely destroyed the Pillar numbers from every angle. You can see more info on these results here. […]
Pingback by Still waiting for Xiotech.. « TechOpsGuys.com — September 26, 2010 @ 2:55 pm
[…] wrote, what I consider a good article on SPC-1 benchmarks a while back, EMC gave me some flak because they don’t believe SPC-1 is a […]
Pingback by Capacity Utilization: Storage « TechOpsGuys.com — October 9, 2010 @ 9:49 am
[…] under $7/IOP which is actually less than their previous results on their T800 from 2008 which was already cheap at […]
Pingback by Linear scalability « TechOpsGuys.com — October 19, 2011 @ 10:03 am