I’ve been waiting to see these final results for a while, and now they are out! The numbers(performance + cost + latency) are actually better than I was expecting.
You can see a massive write up I did on this platform when it was released last year.
(last minute edits to add a new Huawei results that was released yesterday)
(more last minute edits to add a HP P6500 EVA SPC-1E)
SPC-1 Recap
I’ll say this again in case this happens to be read by someone who is new here. Myself, I see value in the SPC-1 as it provides a common playing field for reporting on performance in random transactional workloads (the vast majority of workloads are transactional). On top of the level playing field the more interesting stuff comes in the disclosures of the various vendors. You get to see things like
- Cost (SpecSFS for example doesn’t provide this and the resulting claims from the vendors showing high performance relative to others at a massive cost premium but not disclosing the costs is very sad)
- Utilization (SPC-1 minimum protected utilization is 55%)
- Configuration complexity (only available in the longer full disclosure report)
- Other compromises the vendor might of made (see the note about disabling cache mirroring)
- 3 year 24×7 4 hour on site hardware support costs
There is a brief executive summary as well as what is normally a 50-75 page full disclosure report with the nitty gritty details.
SPC-1 also has maximum latency requirements – no I/O request can take longer than 30ms to serve or the test is invalid.
There is another test suite -Â SPC-2, which tests throughput with various means. Much fewer systems participate in that test (3PAR never has, though I’d certainly like them to).
Having gone through several storage purchases over the years I can say from personal experience it is a huge pain to try to evaluate stuff under real workloads – often times vendors don’t even want to give evaluation gear (that is in fact in large part why I am a 3PAR customer today). Even if you do manage to get something in house to test, there are many things out there, with wide ranging performance / utilization ratios. At least with something like SPC-1 you can get some idea how the system performs relative to other systems at non trivial utilization rates. This example is rather extreme but is a good illustration.
I have no doubt the test is far from perfect, but in my opinion at least it’s far better than the alternatives, like people running 100% read tests with IOMeter to show they can get 1 million IOPS.
I find it quite strange that none of the new SSD startups have participated in SPC-1, I’ve talked to a couple different ones and they don’t like the test, they give the usual it’s not real world, customers should take the gear and test it out themselves. Typical stuff. Usually means they would score poorly – especially those that leverage SSD as a cache tier, with high utilization rates of SPC-1 you are quite likely to blow out that tier, once that happens performance tanks. I have heard reports of some of these guys getting their systems yanked out of production because they fail to perform after utilization goes up. System shines like a star during brief evaluation – then after several months of usage and utilization increasing, performance no longer holds up.
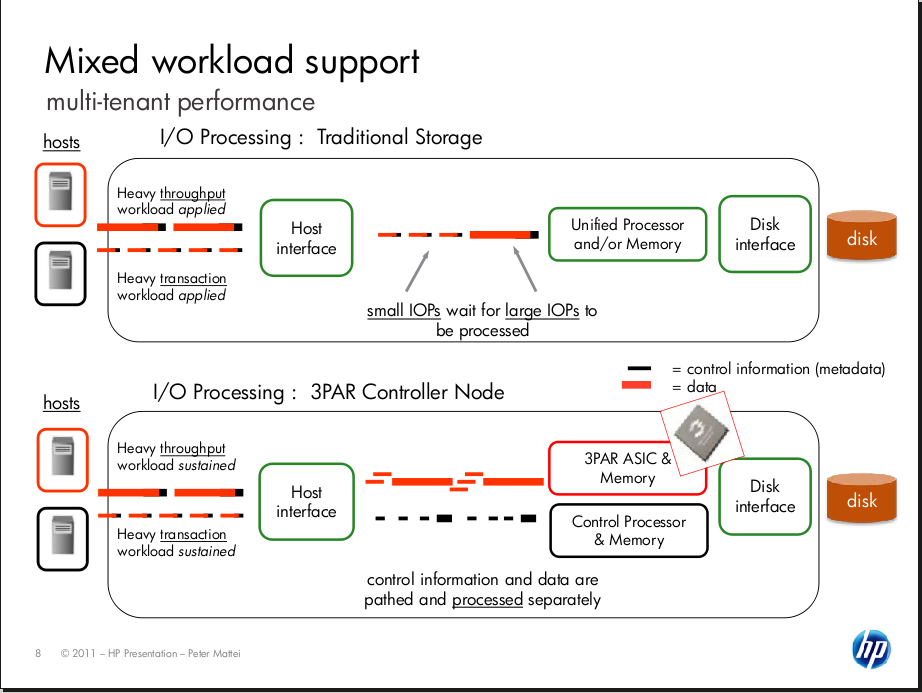
One person said their system is optimized for multiple workloads and SPC-1 is a single workload. I don’t really agree with that, SPC-1 does a ton of reads and writes all over the system, usually from multiple servers simultaneously. I look back to 3PAR specifically, who have been touting multiple workload (and mixed workload) support since their first array was released more than a decade ago. They have participated in SPC-1 for over a decade as well, so arguments saying testing is too expensive etc doesn’t hold water either. They did it when they were small, on systems that are designed from the ground up for multiple workloads (not just riding a wave of fast underlying storage and hoping that can carry them), these new small folks can do it too. If they can come up with a better test with similar disclosures I’m all ears too.
The one place where I think SPC-1 could be improved is in failure testing. Testing a system in a degraded state to see how it performs.
The below results are from what I could find on all SSD SPC-1 results. If there is one/more I have missed(other than TMS, see note below), let me know. I did not include the IBM servers with SSD, since those are..servers.
Test Dates
| System Name | Date Tested |
|---|---|
| HP 3PAR 7400 | May 23, 2013 |
| HP P6500 EVA (SPC-1E) | February 17, 2012 |
| IBM Storwize V7000 | June 4, 2012 |
| HDS Unified Storage 150 | March 26, 2013 |
| Huawei OceanStor Dorado2100 G2 | May 22, 2013 |
| Huawei OceanStor Dorado5100 | August 13, 2012 |
I left out the really old TMS (now IBM) SPC-1 results as they were from 2011, too old for a worthwhile comparison.
Performance / Latency
| System Name | SPC-1 IOPS | Avg Latency (all utilization levels) | Avg Latency (Max utilization) | # of times above 1ms latency | # of SSDs |
|---|---|---|---|---|---|
| HP 3PAR 7400 | 258,078 | 0.66ms | 0.86ms | 0 / 15 | 32x 200GB |
| HP P6500 EVA (SPC-1E) | 20,003 | 4.01ms | 11.23ms | 13 / 15 | 8x 200GB |
| IBM Storwize V7000 | 120,492 | 2.6ms | 4.32ms | 15 / 15 | 18x 200GB |
| HDS Unified Storage 150 | 125,018 | 0.86ms | 1.09ms | 12 / 15 | 20x 200GB |
| Huawei OceanStor Dorado2100 G2 | 400,587 | 0.60ms | 0.75ms | 0 / 15 | 50x 200GB |
| Huawei OceanStor Dorado5100 | 600,052 | 0.87ms | 1.09ms | 7 / 15 | 96x 200GB |
A couple of my own data points:
- Avg latency (All utilization levels) – I just took aggregate latency of “All ASUs” for each of the utilization levels and divided it by 6 (the number of utilization levels)
- Number of times above 1ms of latency – I just counted the number of cells in the I/O throughput table for each of the ASUs (15 cells total) that the test reported above 1ms of latency
Cost
| System Name | Total Cost | Cost per SPC-1 IOP | Cost per Usable TB |
|---|---|---|---|
| HP 3PAR 7400 | $148,737 | $0.58 | $133,019 |
| HP P6500 EVA (SPC-1E) | $130,982 | $6.55 | $260,239 |
| IBM Storwize V7000 | $181,029 | $1.50 | $121,389 |
| HDS Unified Storage 150 | $198,367 | $1.59 | $118,236 |
| Huawei OceanStor Dorado2100 G2 | $227,062 | $0.57 | $61,186 |
| Huawei OceanStor Dorado5100 | $488,617 | $0.81 | $77,681 |
Capacity Utilization
| System Name | Raw Capacity | Usable Capacity | Protected Application Utilization |
|---|---|---|---|
| HP 3PAR 7400 | 3,250 GB | 1,159 GB | 70.46% |
| HP P6500 EVA (SPC-1E) | 1,600 GB | 515 GB | 64.41% |
| IBM Storwize V7000 | 3,600 GB | 1,546 GB | 84.87% |
| HDS Unified Storage 150 | 3,999 GB | 1,717 GB | 85.90% |
| Huawei OceanStor Dorado2100 G2 | 10,002 GB | 3,801 GB | 75.97% |
| Huawei OceanStor Dorado5100 | 19,204 GB | 6,442 GB | 67.09% |
Thoughts
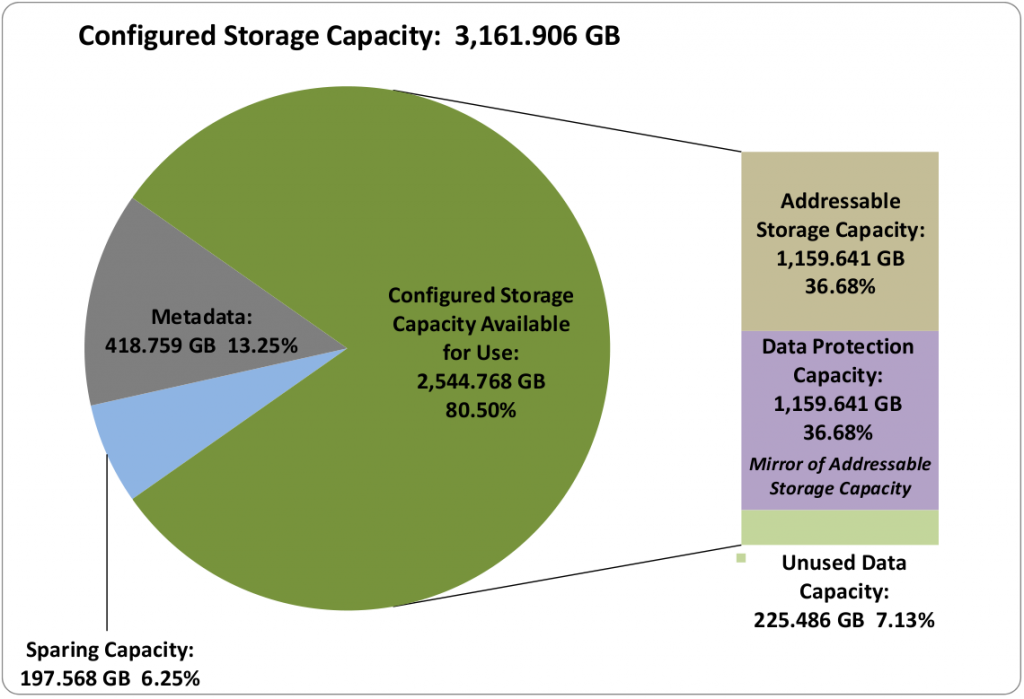
The new utilization charts in the latest 3PAR/Huawei tests are quite nice to see, really good illustrations as to where the space is being used. They consume a full 3 pages in the executive summary. I wish SPC would go back and revise previous reports so they have these new easier forms of disclosure in them. The data is there for users to compute on their own.
HP EVA
This is a SPC-1e result rather than SPC-1 – I believe the work load is the same(?) they just measure power draw in addition to everything else. The stark contrast between the new 3PAR and the older P6500 is remarkable from every angle whether it is cost, performance, capacity, latency. Any way you slice it (well except power I am sure 3PAR draws more power 🙂 )
It is somewhat interesting in the power results for the P6500 that there is only a 16 watt difference between 0% load and 100% load.
I noticed that the P6500 is no longer being sold (P6550 was released to replace it – and the 3PAR 7000-series was released to replace the P6550 which is still being sold).
Huawei
While I don’t expect Huawei to be a common rival for the other three outside of China perhaps, I find their configuration very curious. On the 5100 with such a large number of apparently low cost SLC(!) SSDs, and “short stroking” (even though there are no spindles I guess the term can still apply) they have managed to provide a significant amount of performance at a reasonable cost. I am confused though they claim SLC but yet they have so many disks(would think you’d need fewer with SLC), at the same time at a much lower cost. Doesn’t compute..
No software
Huawei appears to have absolutely no software options for these products – no thin provisioning, no snapshots, no replication, nothing. Usually vendors don’t include any software options as part of the testing since they are not used. In this case the options don’t appear to exist at all.
They seem to be more in line with something that LSI/NetApp E-series, or Infortrend or something like that rather than an enterprise storage system. Though looking at Infortrend’s site earlier this morning shows them supporting thin provisioning, snapshots, and replication on some arrays. Even NetApp seems to have thin provisioning on their E-series included.
3PAR
3PAR’s metadata
3PAR’s utilization in this test is hampered by (relatively) excessive metadata, the utilization results say only 7% unused storage ratio which on the surface is an excellent number. But this number excludes metadata which in this case is 13%(418GB) of the system. Given the small capacity of the system this has a significant impact on utilization (compared to 3PAR’s past results). They are working to improve this.
The next largest meta data size in the above systems is IBM which has only 1GB of metadata (about 99.8% less than 3PAR). I would be surprised if 3PAR was not able to significantly slash the metadata size in the future.
In the grand scheme of things this problem is pretty trivial. It’s not as if the meta data scales linearly with the system.
Only quad controller system
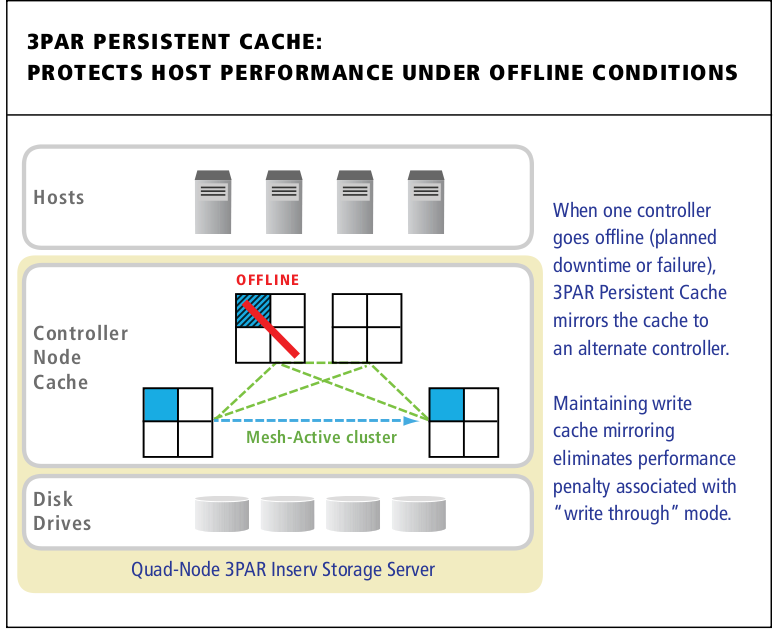
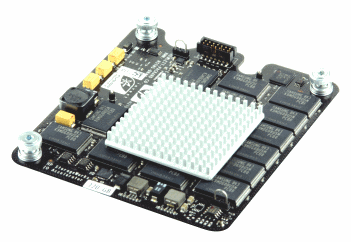
3PAR is the only SSD solution above tested with 4 controllers(totalling 4 Gen4 ASICs, 24 x 1.8Ghz Xeon CPU cores, 64GB of data cache, and 32GB of control cache), meaning with their persistent cache technology(which is included at no extra cost) you can lose a controller and keep a fully protected and mirrored write cache. I don’t believe any of the other systems are even capable of such a configuration regardless of cost.

3PAR Persistent Cache mirrors cache from a degraded controller pair to another pair in the cluster automatically.
The 7400 managed to stay below 1 millisecond response times even at maximum utilization which is quite impressive.
Thin provisioning built in
The new license model of the 3PAR 7000 series means this is the first SPC-1 result to include thin provisioning for a 3PAR system at least. I’m sure they did not use thin provisioning(no point when your driving to max utilization), but from a cost perspective it is something good to keep in mind. In the past thin provisioning would add significant costs onto a 3PAR system. I believe thin provisioning is still a separate license on the P10000-series (though would not be surprised if that changes as well).
Low cost model
They managed to do all of this while remaining a lower cost offering than the competition – the economics of this new 7000 series are remarkable.
IBM’s poor latency
IBM’s V7000 latency is really terrible relative to HDS and HP. I guess that is one reason they bought TMS. Though it may take some time for them to integrate TMS technology (assuming they even try) to have similar software/availability capabilities as their main enterprise offerings.
Conclusion
With these results I believe 3PAR is showing well that they too can easily compete in the all SSD market opportunities without requiring excessive amounts of rack space or power circuits as some of their previous systems required. All of that performance(only 32 of the 48 drive bays are occupied!), in a small 4U package. Previously you’d likely be looking at a absolute minimum of half a rack!
I don’t know whether or not 3PAR will release performance results for the 7000 series on spinning rust, it’s not too important at this point though. The system architecture is distributed and they have proven time and again they can drive high utilization, so it’s just a matter of knowing the performance capacity of the controllers (which we have here), and just throwing as much disk as you want at it. The 7400 series tops out at 480 disks at the moment – even if you loaded it up with 15k spindles you wouldn’t come close to the peak performance of the controllers.
It is, of course nice to see 3PAR trouncing the primary competition in price, performance and latency. They have some work to do on utilization as mentioned above.


