NetApp came out with their latest generation of storage systems recently and they were good citizens and promptly published SPC-1 results for them.
When is clustering, clustering?
NetApp is running the latest Ontap 8.2 in cluster mode I suppose, though there is only a single pair of nodes in the tested cluster. I’ve never really considered this a real cluster, it’s more of a workgroup of systems. Volumes live on a controller (pair) and can be moved around if needed, they probably have some fancy global management thing for the “cluster” but it’s just a collection of storage systems that are only loosely integrated with each other. I like to compare the NetApp style of clustering to a cluster of VMware hosts (where the VMs would be the storage volumes).
This strategy has it’s benefits as well, the main one being less likelihood that the entire cluster could be taken down by a failure(normally I’d consider this failure to be triggered by a software fault). This is the same reason why 3PAR has elected to-date to not go beyond 8-nodes in their cluster, the risk/return is not worth it in their mind. In their latest generation of high end boxes 3PAR decided to double up the ASICs to give them more performance/capacity rather than add more controllers, though technically there is nothing stopping them from extending the cluster further(to my knowledge).
The downside to workgroup style clustering is that optimal performance is significantly harder to obtain.
3PAR clustering is vastly more sophisticated and integrated by comparison. To steal a quote from their architecture document –
The HP 3PAR Architecture was designed to provide cost-effective, single-system scalability through a cache-coherent, multi-node, clustered implementation. This architecture begins with a multi-function node design and, like a modular array, requires just two initial Controller Nodes for redundancy. However, unlike traditional modular arrays, an optimized interconnect is provided between the Controller Nodes to facilitate Mesh-Active processing. With Mesh-Active controllers, volumes are not only active on all controllers, but they are autonomically provisioned and seamlessly load-balanced across all systems resources to deliver high and predictable levels of performance. The interconnect is optimized to deliver low latency, high-bandwidth communication and data movement between Controller Nodes through dedicated, point-to-point links and a low overhead protocol which features rapid inter-node messaging and acknowledgement.
Sounds pretty fancy right? It’s not something that is for high end only. They have extended the same architecture down as low as a $25,000 entry level price point on the 3PAR 7200 (that price may be out of date, it’s from an old slide).
I had the opportunity to ask what seemed to be a NetApp expert on some of the finer details of clustering in Ontap 8.1 (latest version is 8.2) a couple of years ago and he provided some very informative responses.
Anyway on to the results, after reading up on them it was hard for me not to compare them with the now five year old 3PAR F400 results.
Also I want to point out that the 3PAR F400 is End of Life, and is no longer available to purchase as new as of November 2013 (support on existing systems continues for another couple of years).
| Metric | NetApp FAS8040 | 3PAR F400 |
|---|---|---|
| Date tested | 2/19/2014 | 4/27/2009 |
| Controller Count | 2 | 4 (hey, it's an actual cluster) |
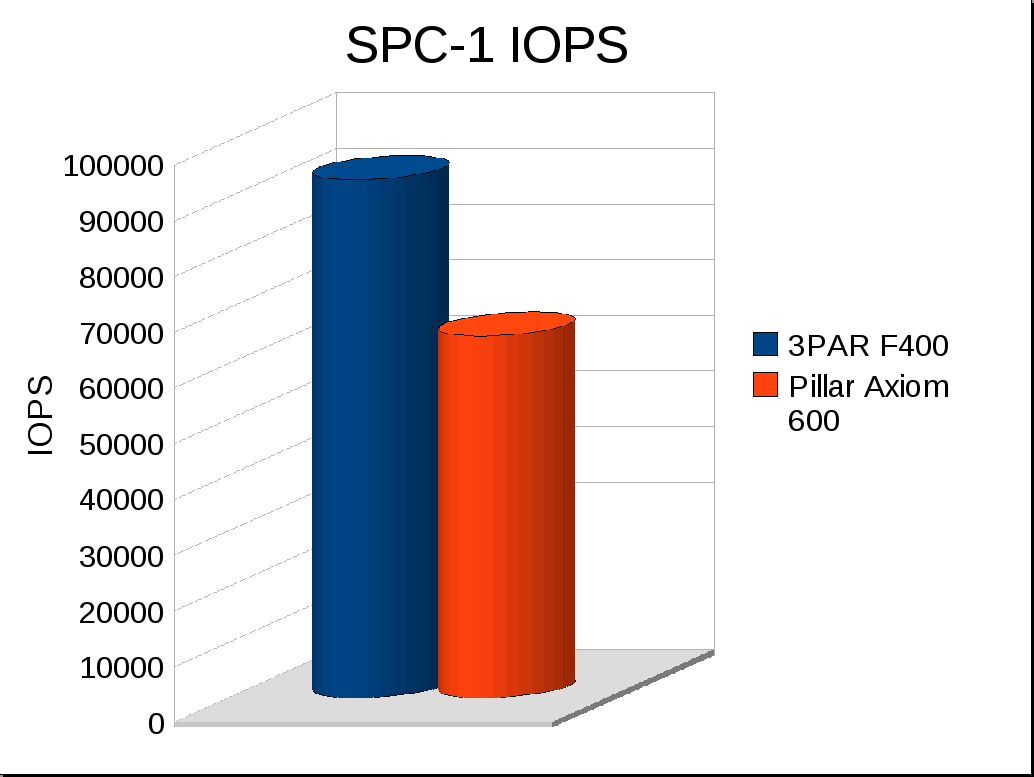
| SPC-1 IOPS | 86,072 | 93,050 |
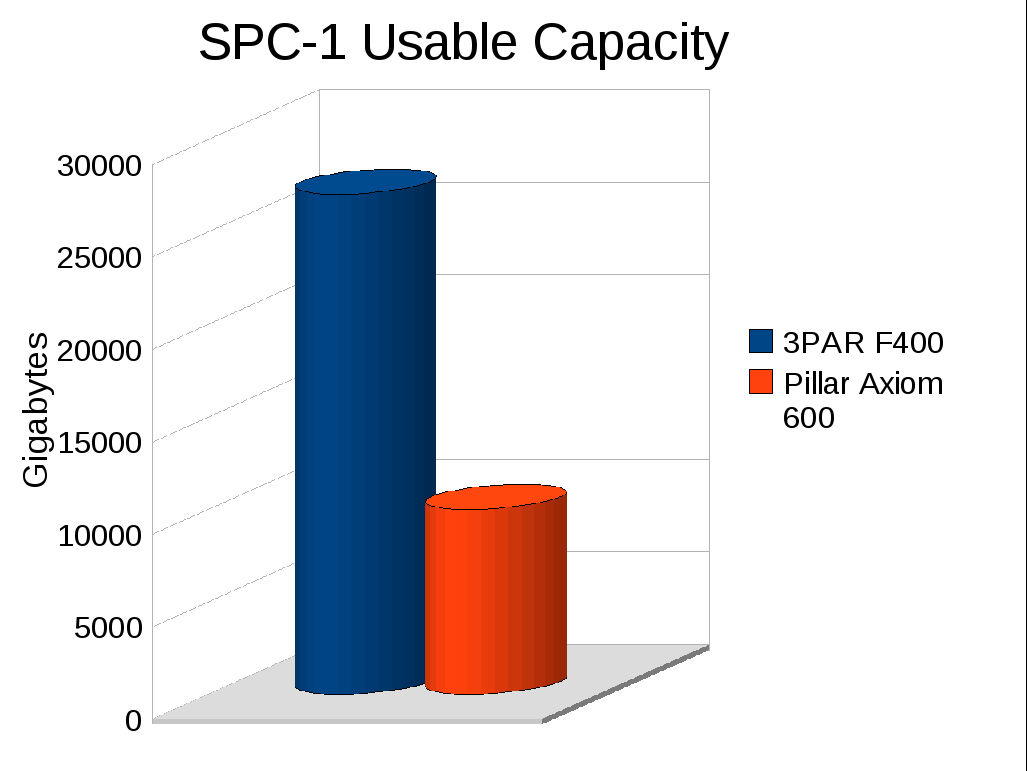
| SPC-1 Usable Capacity | 32,219 GB (RAID 6) | 27,046 GB (RAID 1) |
| Raw Capacity | 86,830 GB | 56,377 GB |
| SPC-1 Unused Storage Ratio (may not exceed 45%) | 41.79% | 0.03% |
| Tested storage configuration pricing | $495,652 | $548,432 |
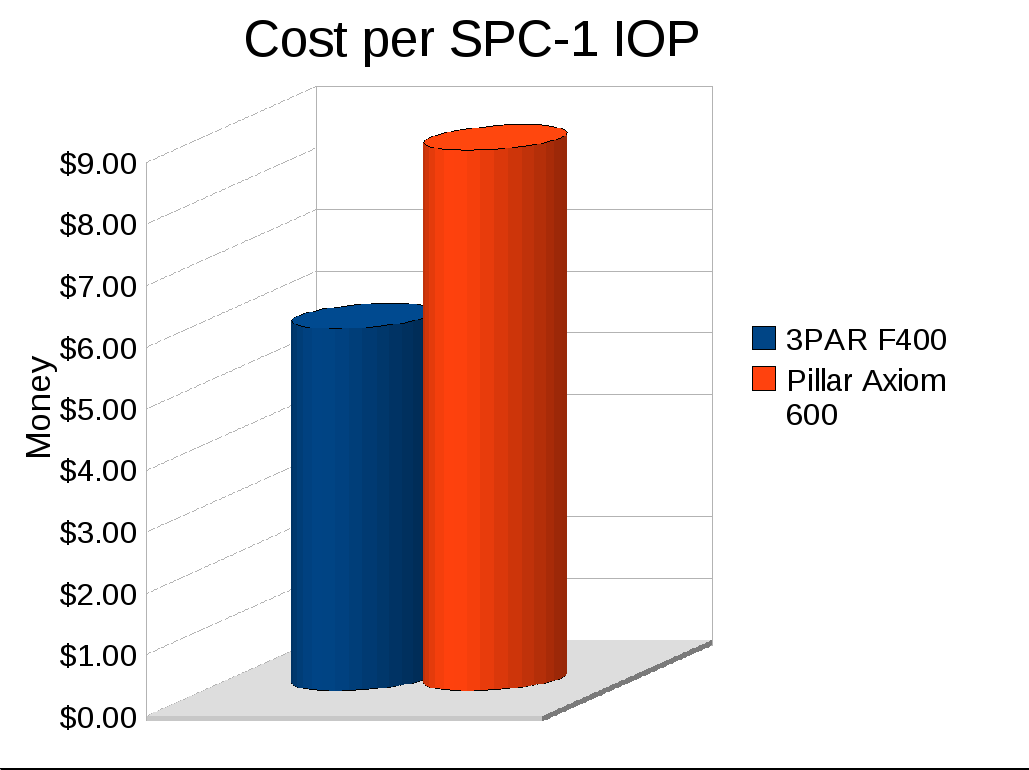
| SPC-1 Cost per IOP | $5.76 | $5.89 |
| Disk size and number | 192 x 450GB 10k RPM | 384 x 146GB 15k RPM |
| Data Cache | 64GB data cache 1,024GB Flash cache | 24GB data cache |
I find the comparison fascinating myself at least. It is certainly hard to compare the pricing, given the 3PAR results are five years old, the 3PAR mid range pricing model has changed significantly with the introduction of the 7000 series in late 2012. I believe the pricing 3PAR provided SPC-1 was discounted(I can’t find indication either way, I just believe that based on my own 3PAR pricing I got back then) vs NetApp is list(says so in the document). But again, hard to compare pricing given the massive difference in elapsed time between tests.
Unused storage ratio
What is this number and why is there such a big difference? Well this is a SPC-1 metric and they say in the case of NetApp:
Total Unused Capacity (36,288.553 GB) divided by Physical Storage Capacity (86.830.090 GB) and may not exceed 45%.
A unused storage ratio of 42% is fairly typical for NetApp results.
In the case of 3PAR, you have to go to the bigger full disclosure document(72 pages), as the executive summary has evolved more over time and that specific quote is not in the 3PAR side of things.
So for 3PAR F400 SPC says:
The Physical Storage Capacity consisted of 56,377.243 GB distributed over 384 disk drives each with a formatted capacity of 146.816 GB. There was 0.00 GB (0.00%) of Unused Storage within the Physical Storage Capacity. Global Storage Overhead consisted of 199.071 GB (0.35%) of Physical Storage Capacity. There was 61.203 GB (0.11%) of Unused Storage within the Configured Storage Capacity. The Total ASU Capacity utilized 99.97% of the Addressable Storage Capacity resulting in 6.43 GB (0.03%) of Unused Storage within the Addressable Storage Capacity.
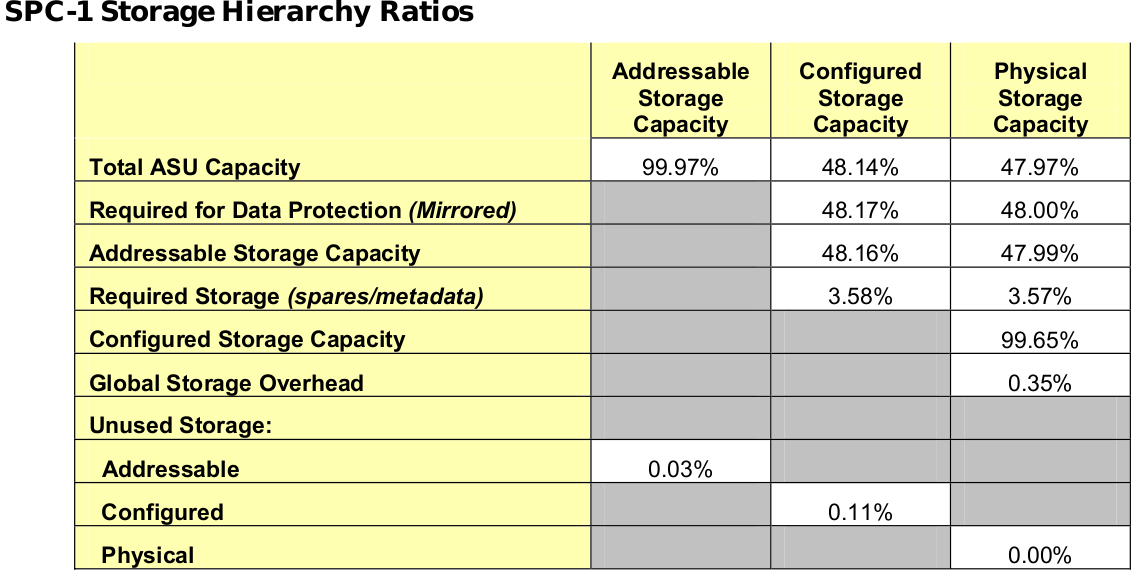
3PAR F400 Storage Hierarchy Ratios
The full disclosure document is not (yet) available for NetApp as of 2/21/2014. It most certainly will become available at some point.
The metrics above and beyond the headline numbers is one of the main reasons I like SPC-1.
With so much wasted space on the NetApp side it is confusing to me why they don’t just use RAID 1 (I think the answer is they don’t support it).
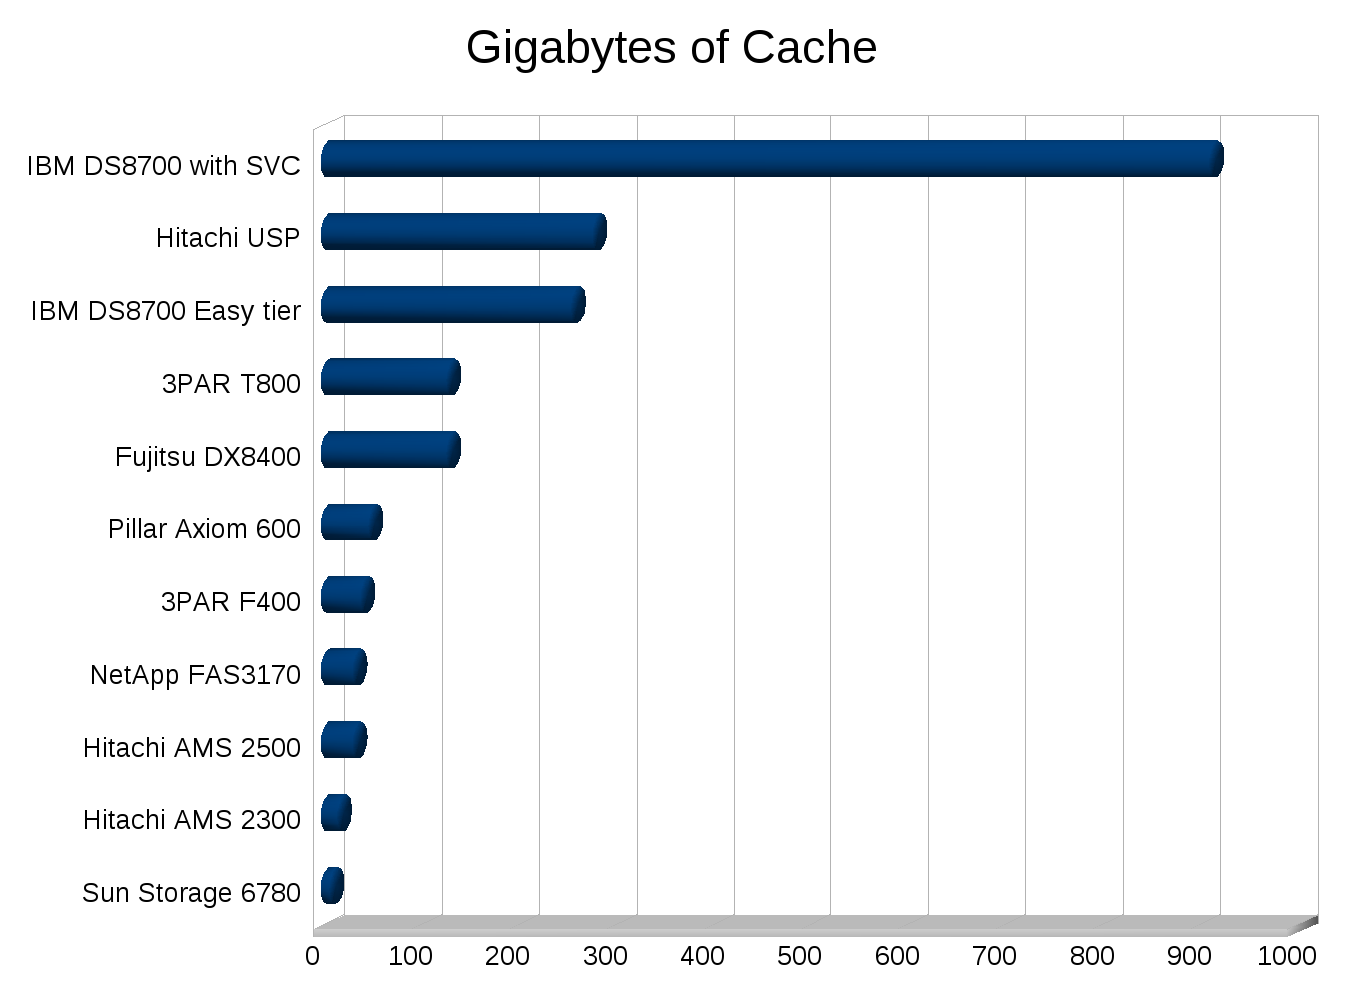
Benefits from cache
The NetApp system is able to leverage it’s terabyte of flash cache to accelerate what is otherwise a slower set of 10k RPM disks, which is nice for them.
They also certainly have much faster CPUs, and more than double the data cache (3PAR’s architecture isolates data cache from the operating system, so I am not sure how much memory on the NetApp side is actually used for data cache vs operating system/meta data etc). 3PAR by contrast has their proprietary ASIC which is responsible for most of the magic when it comes to data processing on their systems.
3PAR does not have any flash cache capabilities so they do require (in this comparison) double the spindle count to achieve the same performance results. Obviously in a newer system configuration 3PAR would likely configure a system with SSDs and sub LUN auto tiering to compensate for the lack of a flash based cache. This does not completely completely compensate however, and of course I have been hounding 3PAR and HP for at least four years now to develop some sort of cache technology that leverages flash. They announced SmartCache in December 2012 (host-based SSD caching for Gen8 servers) however 3PAR integration has yet to materialize.
However keep in mind the NetApp flash cache only accelerates reads. If you have a workload like mine which is 90%+ write the flash cache doesn’t help.
Conclusion
NetApp certainly makes good systems, they offer a lot of features, and have respectable performance. The systems are very very flexible and they have a very unified product line up (same software runs across the board).
For me personally after seeing results like this I feel continually reassured that the 3PAR architecture was the right choice for my systems vs NetApp (or other 3 letter storage companies). But not everyone’s priorities are the same. I give NetApp props for continuing to support SPC-1 and being public with their numbers. Maybe some day these flashy storage startups will submit SPC-1 results…….not holding my breath though.


