TechOpsGuys.com Diggin' technology every day

June 15, 2010

Storage Benchmarks

Filed under: Storage — Tags: , — Nate @ 11:27 pm

There are two main storage benchmarks I pay attention to:
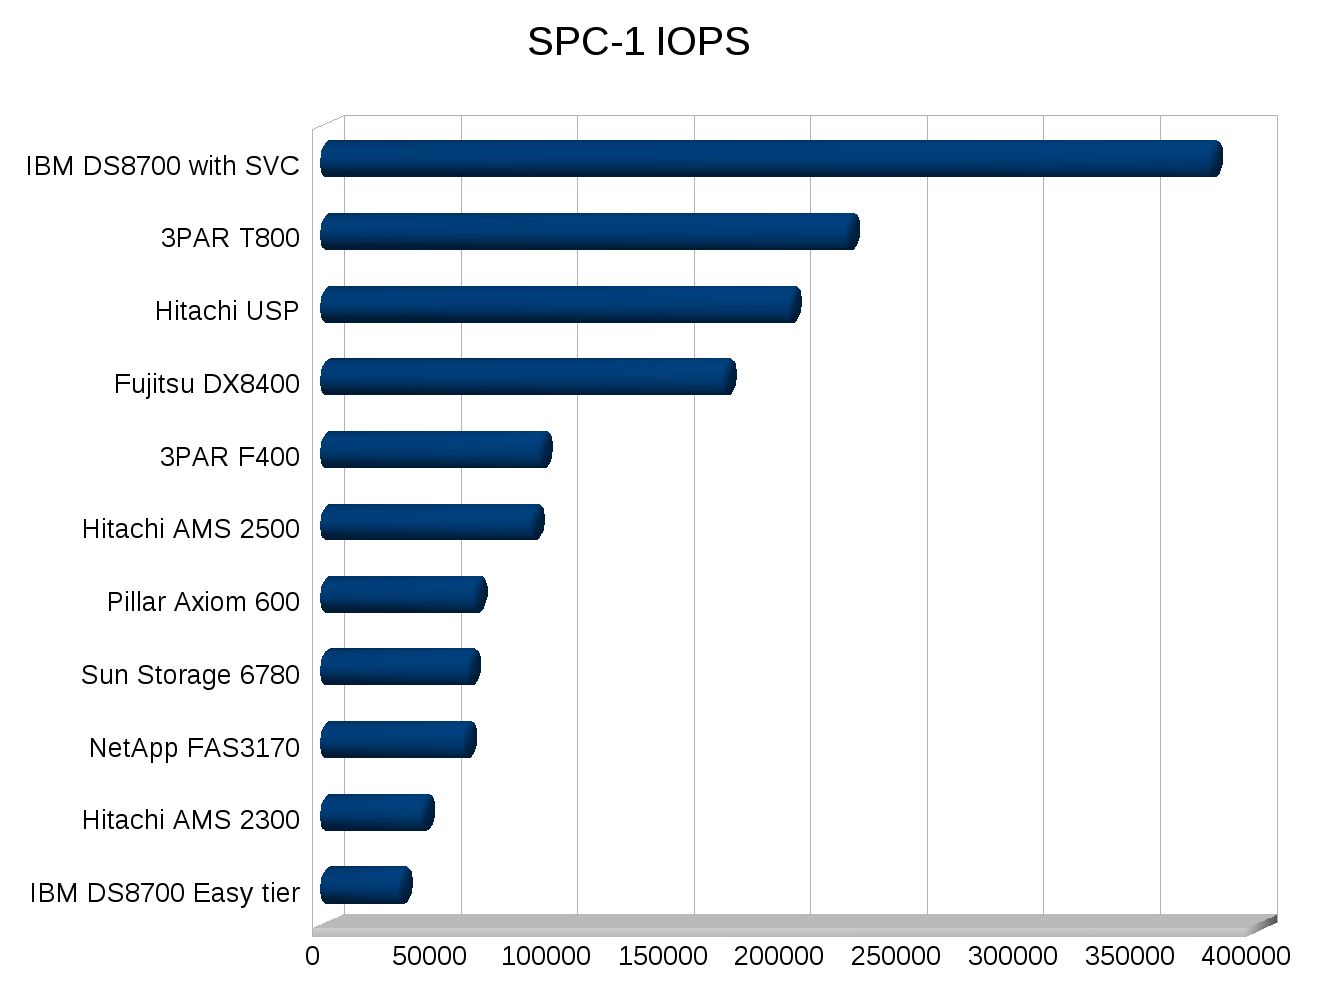
Of course benchmarks are far from perfect, but they can provide a good starting point when determining what type of system you need to look towards based on your performance needs. Bringing in everything under the sun to test in house is a lot of work, much of it can be avoided by getting some reasonable expectations up front. Both of these benchmarks do a pretty good job. And it’s really nice to have the database of performance results for easy comparison. There’s tons of other benchmarks that can be used but very few have a good set of results you can check against.

SPC-1 is better as a process primarily because it forces the vendor to disclose the cost of the configuration and 3 years of support. They could improve on this further by forcing the vendor to provide updating pricing to the configuration for 3 years, while the performance of the configuration should not change(given the same components), the price certainly should decline over time so the cost aspects become harder to compare the further apart the tests(duh).

SPC-1 also forces full disclosure of everything required to configure the system, down to the CLI commands to configure the storage. You can get a good idea on how simple or complex the system is by looking at this information.

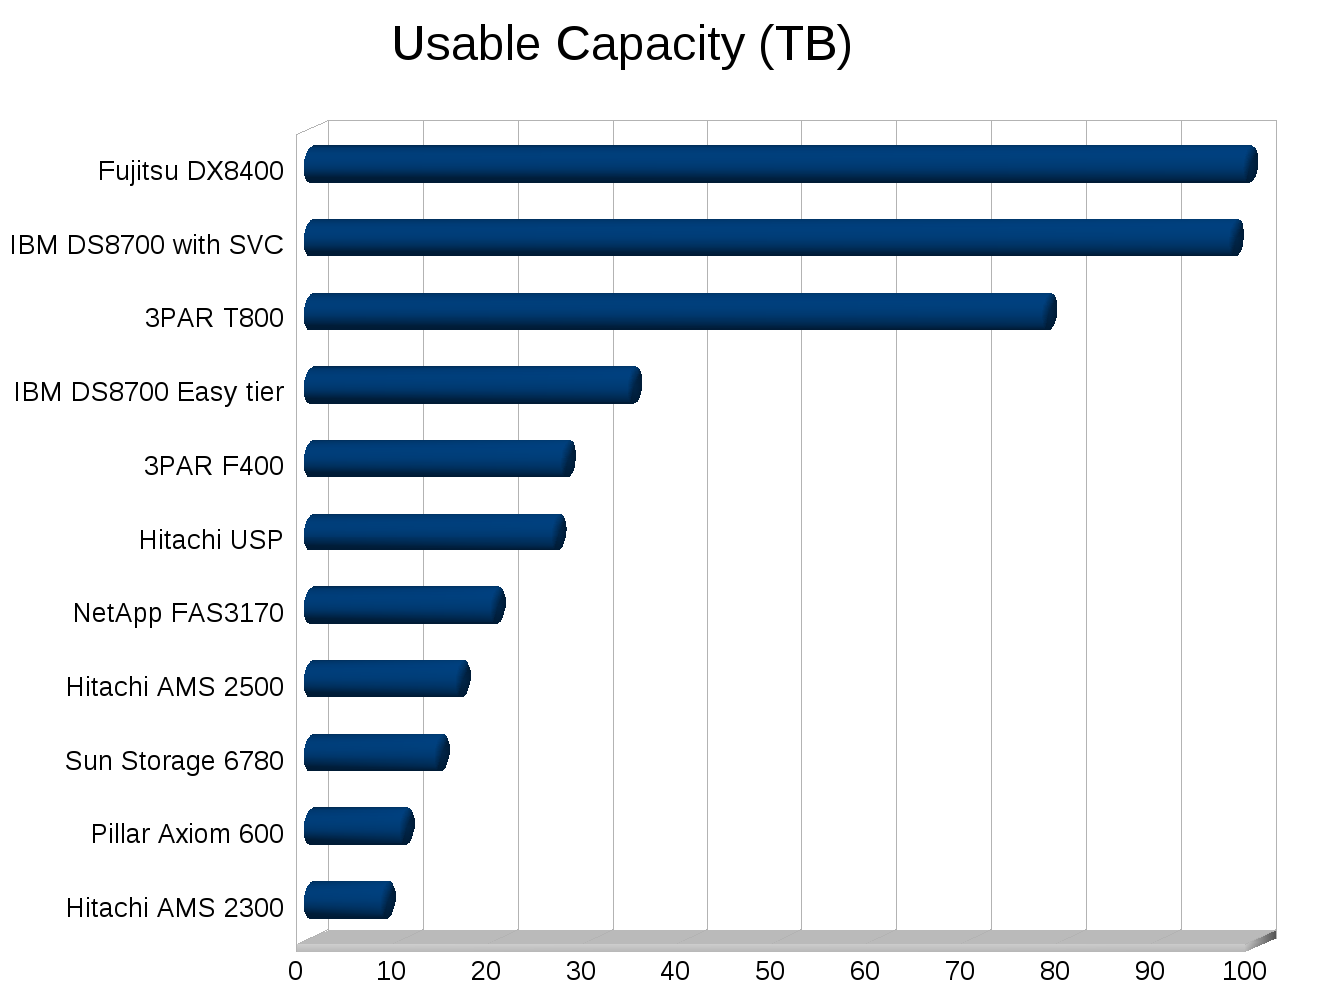
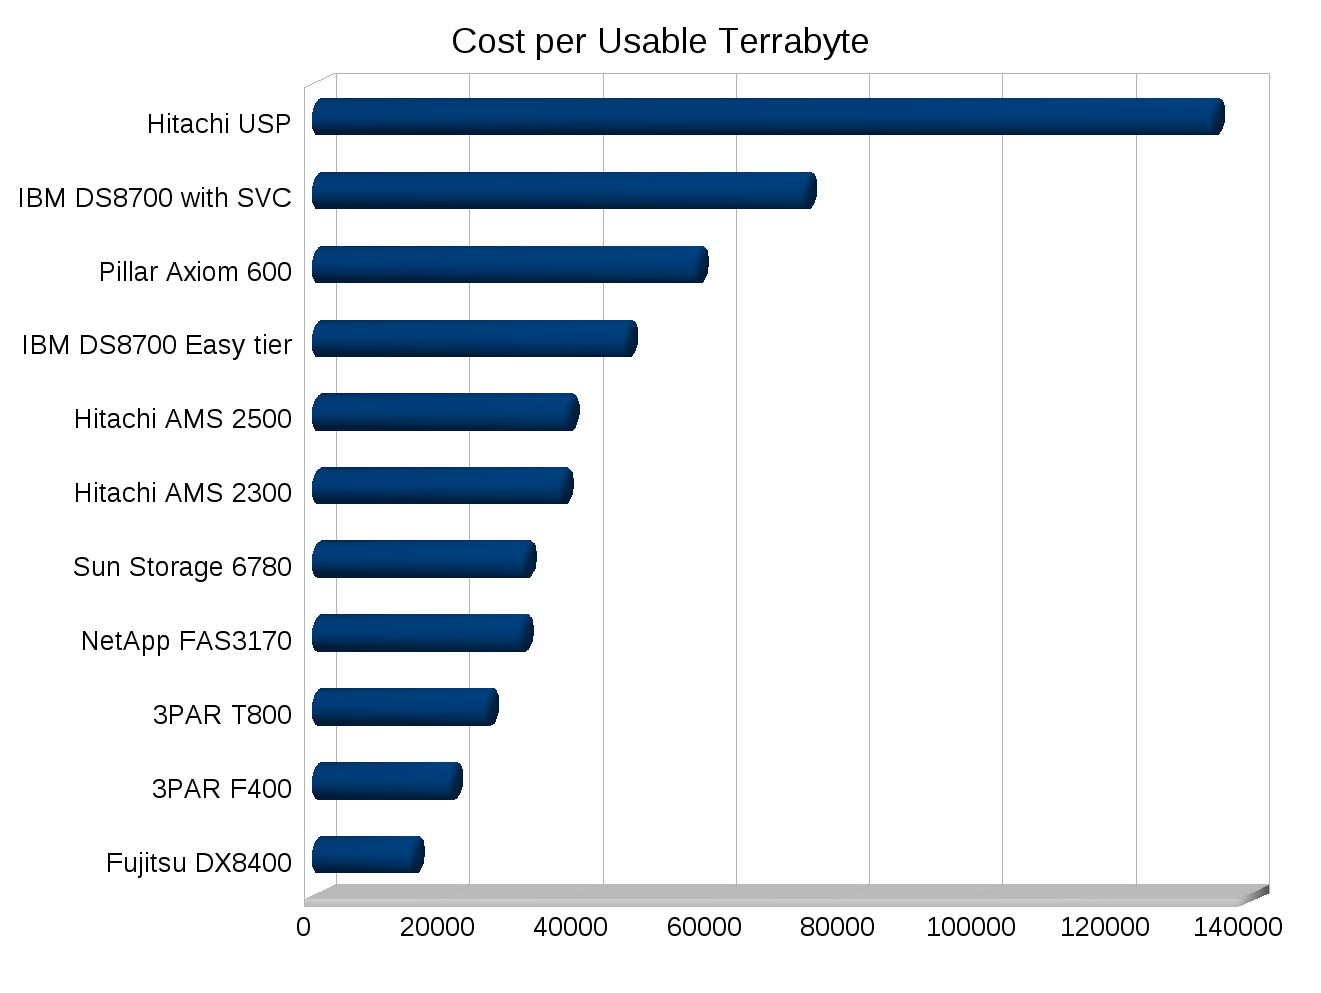
SPC-1 doesn’t have a specific disclosure field for Cost per Usable TB. But it is easy enough to extrapolate from the other numbers in the reports, it would be nice if this was called out(well nice for some vendors, not so much for others). Cost per usable TB can really make systems that utilize short stroking to get performance stand out like a sore thumb. Another metric that would be interesting would be Watts per IOP and Watts per usable TB. The SPC-1E test reports Watts per IOP,  though I have hard time telling whether or not the power usage is taken at max load, seems to indicate power usage was calculated at 80% load.

Storage performance is by no means the only aspect you need to consider when getting a new array, but it usually is in at least the top 5.

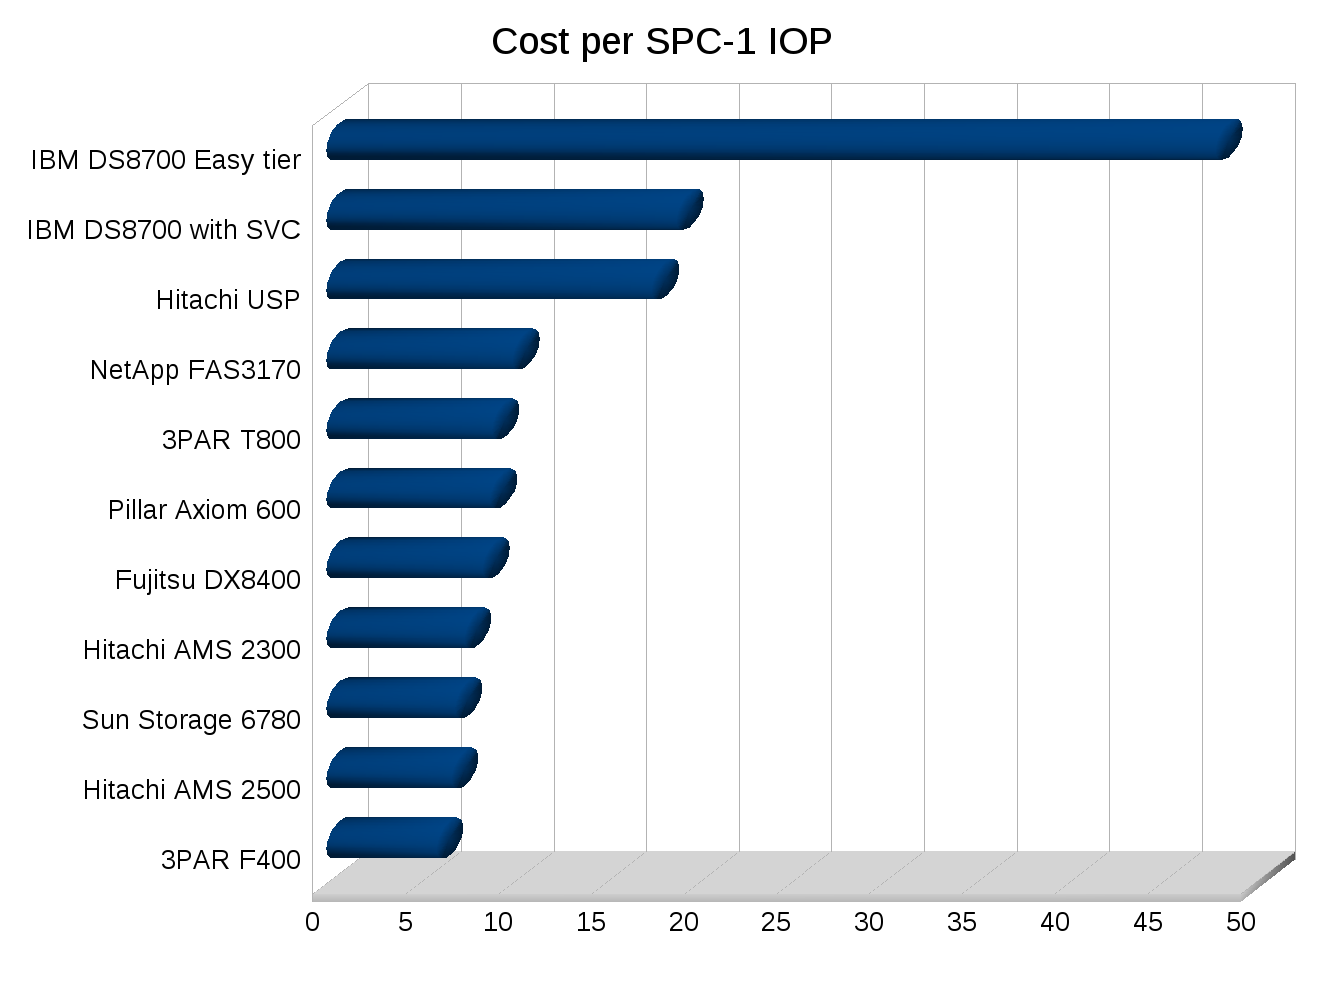
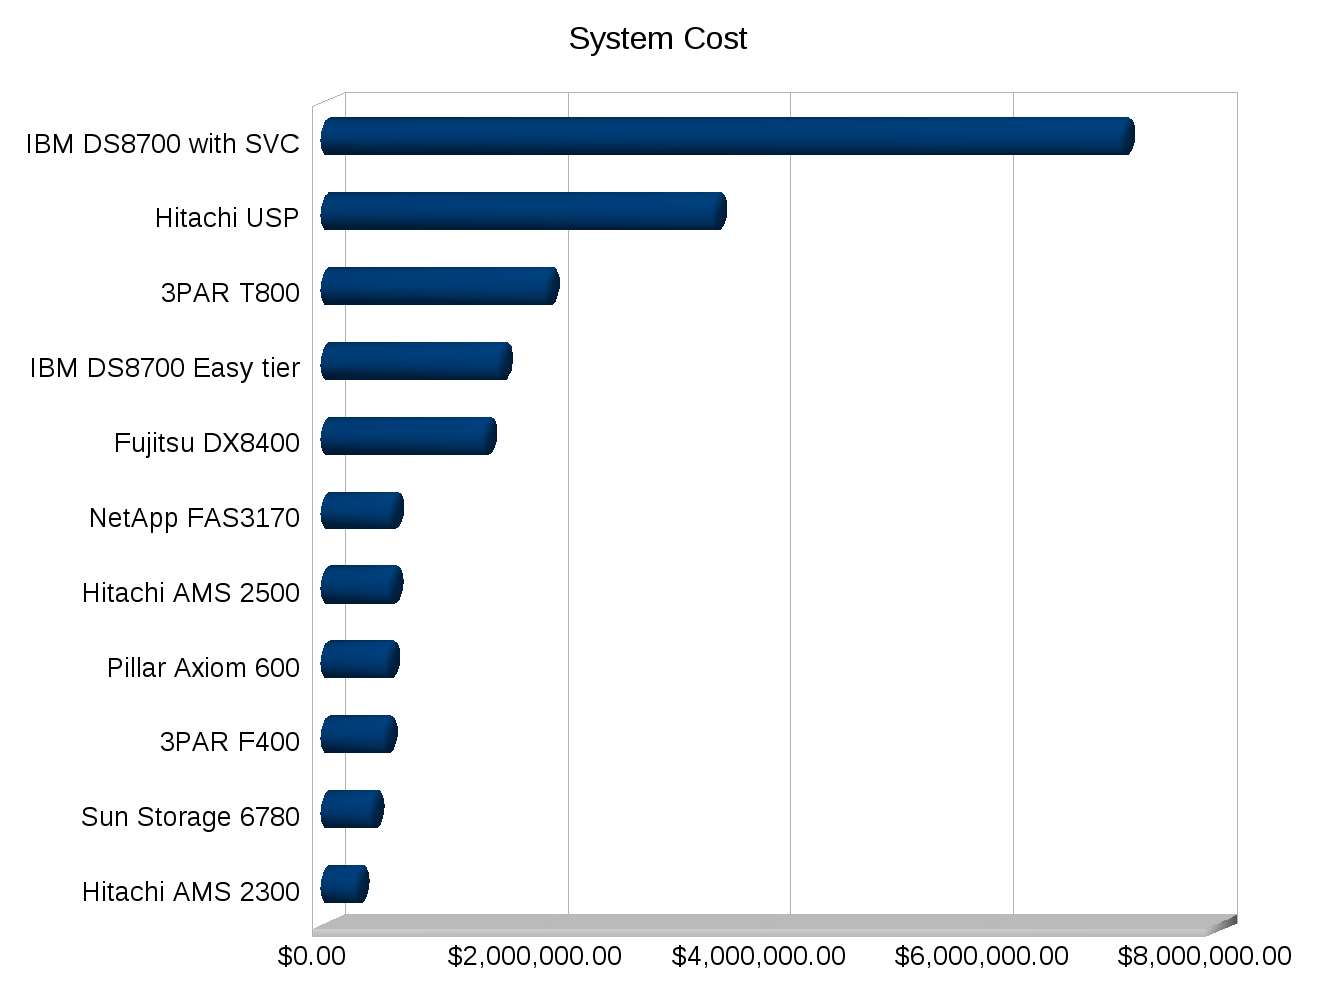
I made a few graphs for some SPC-1 numbers, note the cost numbers need to be taken with a few grains of salt of course depending on how close the systems were tested, the USP for example was tested in 2007. But you can see trends at least.

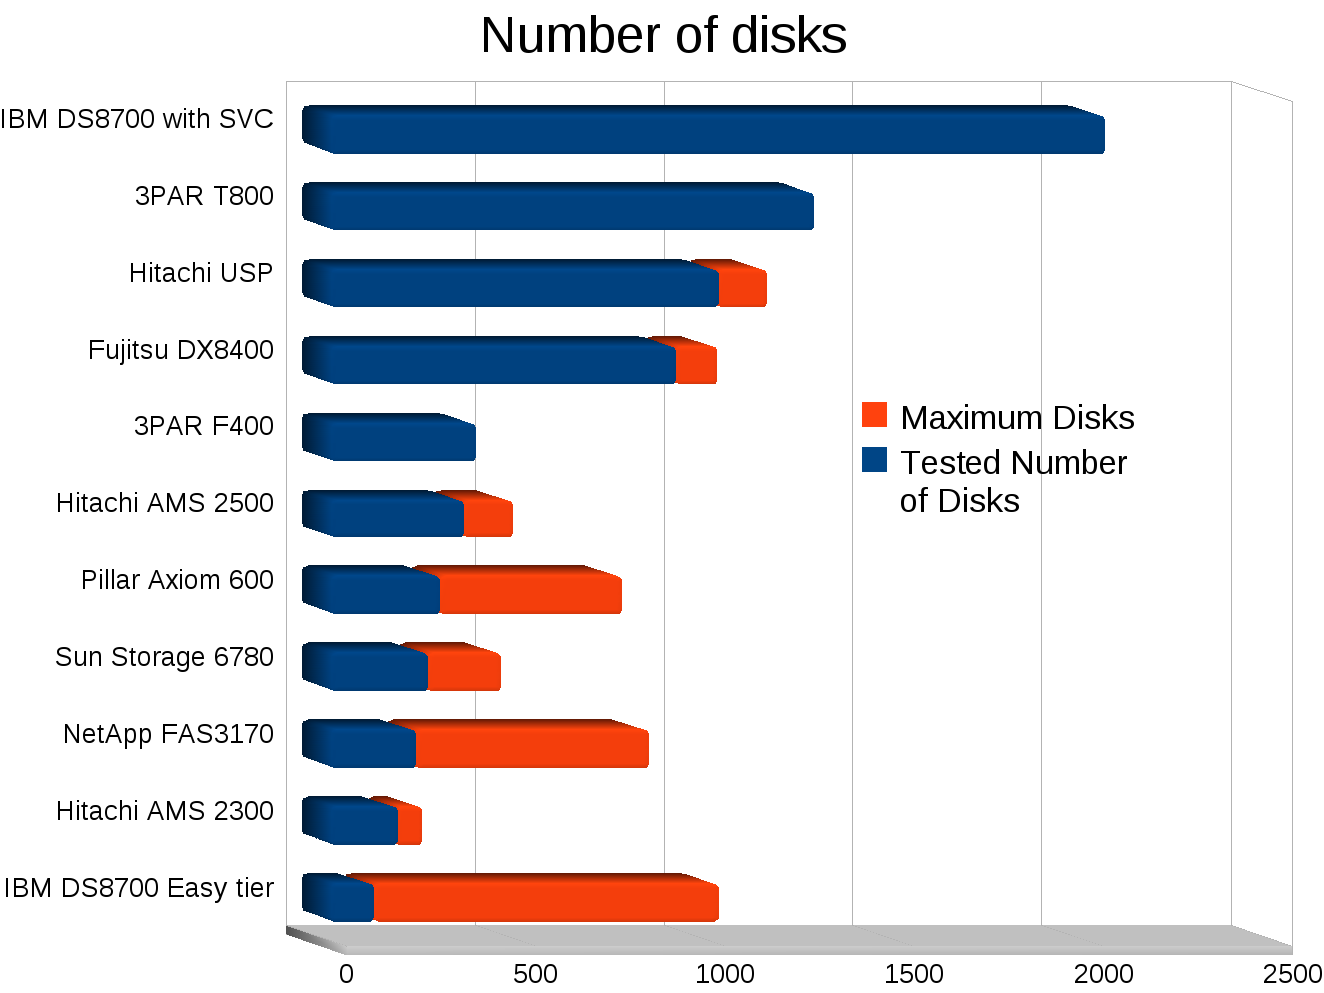
The majority of the systems tested used 146GB 15k RPM disks.

Somewhat odd configurations:

  • From IBM, the easy tier config is the only one that uses SSD+SATA, and the other IBM system is using their SAN Volume Controller in a clustered configuration with two storage arrays behind it (two thousand spindles).
  • Fujitsu is short stroking 300GB disks.
  • NetApp is using RAID 6 (except IBM’s SSDs everyone else is RAID 1)

I’ve never been good with spreadsheets or anything so I’m sure I could make these better, but they’ll do for now.

Links to results:

April 14, 2010

First SPC-1 Numbers with automagic storage tiering

Filed under: News,Storage — Tags: , , , — Nate @ 8:38 am

IBM recently announced that they are adding an “easy tier” of storage to some of their storage systems. This seems to be their form of what I have been calling automagic storage tiering. They are doing it at the sub LUN level in 1GB increments. And they recently posted SPC-1 numbers for this new system, finally someone posted numbers.

Configuration of the system included:

  • 1 IBM DS8700
  • 96 1TB SATA drives
  • 16 146GB SSDs
  • Total ~100TB raw space
  • 256GB Cache

Performance of the system:

  • 32,998 IOPS
  • 34.1 TB Usable space

Cost of the system:

  • $1.58 Million for the system
  • $47.92 per SPC-1 IOP
  • $46,545 per usable TB

Now I’m sure the system is fairly power efficient given that it only has 96 spindles on it, but I don’t think that justifies the price tag. Just take a look at this 3PAR F400 which posted results almost a year ago:

  • 384 disks, 4 controllers, 24GB data cache
  • 93,050 SPC-1 IOPS
  • 26.4 TB Usable space (~56TB raw)
  • $548k for the system (I’m sure prices have come down since)
  • $5.89 per SPC-1 IOP
  • $20,757 per usable TB

The system used 146GB disks, today the 450GB disks seem priced very reasonably, I would opt for those instead and get the extra space for not much of a premium.

Take a 3PAR F400 with 130 450GB 15k RPM disks, that would be about 26TB of usable space with RAID 1+0 (the tested configuration above is 1+0). That would give about 33.8% of the performance of the above 384-disk system, so say 31,487 SPC-1 IOPS, very close to the IBM system and I bet the price of the 3PAR would be close to half of the $548k above (taking into account the controllers in any system are a good chunk of the cost). 3PAR has near linear scalability making extrapolations like this possible and accurate. And you can sleep well at night knowing you can triple your space/performance online without service disruption.

Note of course you can equip a 3PAR system with SSD and use automagic storage tiering as well, they call it Adaptive Optimization, if you really wanted to. The 3PAR system moves data around in 128MB increments by contrast.

It seems the cost of the SSDs and the massive amount of cache IBM dedicated to the system more than offset the benefits of using lower cost nearline SATA disks in the system. If you do that, what’s the point of it then?

So consider me not impressed with the first results of automagic storage tiering. I expected significantly more out of it. Maybe it’s IBM specific, maybe not, time will tell.

March 11, 2010

Panasas NFS performance posted

Filed under: Storage — Tags: , , , — Nate @ 5:48 pm

I have heard of Panasas on occasion and for some reason recently I saw a story or a link to them so I decided to poke around to see what they do. I like technology..

Anyways I was shocked to see their system design. I mean I’ve seen systems like Isilon and Xiotech and Pillar who have embedded controllers in each of their storage shelves, this is an interesting concept for boosting performance though given the added complexity and stuff to each shelf I imagine can boost the costs by quite a bit too I don’t know.

But Panasas has taken it to an even further extreme, putting a disk controller for every two disks in the system! I mean I’m sure it’s great for maximum performance but wow, it just seems like such a massive overkill(which can be good for certain apps I’m sure). I was/am still shocked 🙂

So today I was poking around again at the latest SPEC SFS results for NFS, and saw they posted some numbers finally.

Fairly impressive numbers but I just can’t get past the number of CPUs they are using. They posted 77,137 IOPS with 160 disks hosting NAS data (80 SATA and 80 SSD). They used a total of 110 Intel CPUs (80 1.5Ghz Celerons and 30 1.8Ghz Pentium Ms) and 440 gigabytes of  RAM cache.

By contrast, Avere which I posted about recently (never used their stuff, never talked to them before), posted 131,591 IOPS with 72 disks hosting NAS data(48 15k SAS, 24 SATA), 14 Intel CPUs(2.5Ghz quad core, so 56 cores) and 423 gigabytes of RAM cache. This is on a 6-node cluster. This Avere configuration is not using SSD (they released an SSD version since these results were posted)

The bar certainly is being raised by these players implementing massive caches. NetApp showed off some pretty impressive numbers as well with their PAM last year, more than 500GB of cache(PAM is a read cache only) though again not nearly as effective as Avere since they came in at 60,507 IOPS with 56 15k RPM disks.

Powered by WordPress