TechOpsGuys.com Diggin' technology every day

August 5, 2009

FTP to your tape drive

Filed under: Storage — Nate @ 7:53 pm

Just got done with an evaluation of a new product on the market, a Cache-A Prime Cache tape drive. It is based off the same technology that the Quantum Superloader 3A. Quantum as a company hasn’t been doing too hot recently, I was told that they basically let go of the entire team responsible for developing the software for the Superloader 3A. Cache-A then went in and either bought or at least licensed the software to continue development at their company. The first product was released in late June 2009, the Prime Cache, which is a single LTO-4 tape drive hooked up to a small computer running Fedora 10. They have a fairly easy to use UI that is web based.

You can either FTP or use CIFS to interface with the device to upload files. It stages the files on a local internal disk which they call the VTAPE, once the file is uploaded to the share then the system automatically sends it to tape. Eventually it will support NFS as well. It does have the ability to mount remote NFS/CIFS shares and back them up directly though there are some limitations in the current software release. I was unable to get it to see any files on our main NAS cluster which runs Samba for CIFS, and was unable to mount NFS volumes it depends currently on another software package(forgot the name) which broadcasts the available NFS exports to the network for the device to see them, no ability yet to manually input a NFS server/mount point to go to.

I like the concept because being able to use FTP or even smbclient on the command line to be able to tie directly into a tape drive from backup scripts is real handy for me. Add to that pretty much any system on the network being able to push files to the tape without having to go through special backup software has it’s appeals as well. Most of our data that needs to be backed up is spread out all over the place, and I have scripts that gathers the paths and file names of the files that need backing up. Our MySQL database backups are also heavily scripted as well involving snapshots from the SAN etc. So being able to put a few lines of code in the script to pass the files along to the tape is nice.

The system is quite new so has some bugs, and some things aren’t implimented yet, like the ability to delete files directly from the tape or erase/format the tape without using the WebUI, that is coming(along with an API), though no ETA. The device retails for about $7k I believe, which is roughly 1/2 the cost of the SuperLoader 3A. Though this is just one tape drive, no autoloader yet. Though it is LTO-4 and the SuperLoader 3A is LTO-3(with no expectations of it ever being able to get to be LTO-4).

I’ll certainly be following this product/company pretty closely in the future myself as I really like the way they are going, this is certainly a very innovative product, other than the SuperLoader I haven’t seen any other product like it on the market.
August 4, 2009

1 Billion events in Splunk

Filed under: Monitoring — Nate @ 10:43 pm

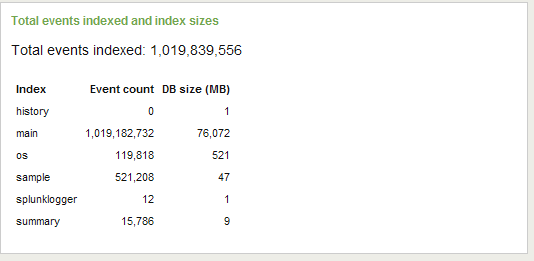
I was on a conference call with Splunk about a month or so ago, we recently bought it after using it off and on for a while. One thing that stuck out to me on that call was the engineer’s excitement around being able to show off a system that had a billion events in it. I started a fresh Splunk database in early June 2009 I think it was, and recently we passed 1 billion events. The index/DB(whatever you want to call it) just got to about 100GB(the below screenshot is a week or two old). The system is still pretty quick too. Running on a simple dual Xeon system with 8GB memory, and a software iSCSI connection to the SAN.

We have something like 400 hosts logging to it(just retired about 100 additional ones about a month ago, going to retire another 80-100 in the coming weeks as we upgrade hardware). It’s still not fully deployed right now about 99% of the data is from syslog.

Upgraded to Splunk v4 the day it came out, it has some nice improvements, filed a bug the day it came out too(well a few), but the most annoying one is I can’t login to v4 with Mozilla browsers(nobody in my company can). Only with IE. We suspect it’s some behavioral issue with our really basic Apache reverse proxy and Splunk. The support guys are looking at it still. That and both their Cisco and F5 apps do not show any data despite having millions of log events from both Cisco and F5 devices in our index. They are looking into that too.

1 billion logged events

1 billion logged events

Will it hold?

Filed under: Monitoring,Storage — Tags: , , — Nate @ 10:21 pm

I went through a pretty massive storage refresh earlier this year which cut our floorspace in half, power in half, disks in half etc. Also improved performance at the same time. It’s exceeded my expectations, more recently though I have gotten worried as far as how far will the cache+disks scale to before they run out of gas. I have plans to increase the disk count by 150% (from 200 to 300) at the end of the year, but will we last until then? My  past(admittedly limited) storage experience  says we should already be having lots of problems but we are not. The system’s architecture and large caches are absorbing the hit, the performance remains high and very responsive to the servers. How long will that hold up though?  There are thousands of metrics available to me but the one metric that is not available is cache utilization, I can get hit ratios on tons of things, but no info on how full the cache is at any particular period of time(for either NAS or SAN).

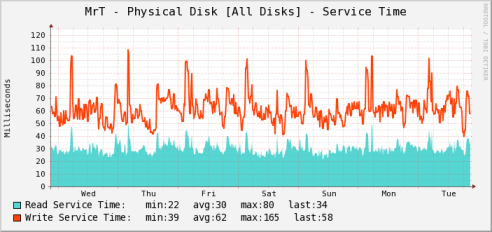
To illustrate my point, here is a graphic from my in-house monitoring showing sustained spindle response times over 60 milliseconds:

Physical Disk response time

Physical Disk response time

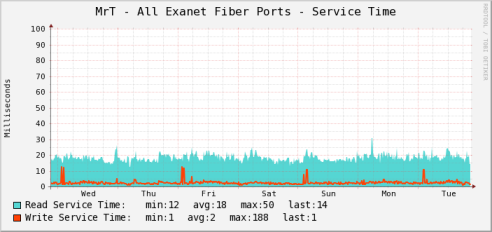
And yet on the front end, response times are typically 2 milliseconds:

Fiber channel response time to NAS cluster

Fiber channel response time to NAS cluster

There are spikes of course, there is a known batch job that kicks off tons of parallel writes which blows out the cache on occasion, a big gripe I have with the developers of the app and their inability to(so far) throttle their behavior. I do hold my breath on occasion when I personally witness the caches(if you add up both NAS+SAN caches it’s about 70GB of mirrored memory) getting blown out. But as you can see both on the read and especially write side the advanced controllers are absorbing a huge hit. And the trend over the past few months has been a pretty steep climb upwards as more things run on the system. My hope is things level off soon, that hasn’t happened yet.

The previous arrays I have used would not of been able to sustain this, by any stretch.

Will it hold?

Making RRD output readable

Filed under: Monitoring — Tags: , , , , — @ 8:19 pm

I have been doing a lot of work lately with creating new data points to monitor with cacti and when trouble shooting why a new data point is not working I have been running into a bit of an issue.  I can see what my script is handing to the cacti poller, I can see what cacti is putting in the RRD file (with increased logging), but I can’t easily see what RRD has done with that data before handing off to cacti.  By default RRD store’s the time stamps in Epoch Time (seconds since midnight on Jan 1st, 1970) and data in scientific notation. Now, I don’t know about you, but I can’t read either of those without some help so here is my little Ruby script helper

#!/usr/bin/env ruby
# Author: W. David Nash III
# Version 0.1
# August 3, 2009

count = 0
STDIN.each do|l|

        count += 1

        printf("%-3i | ",count)

        if !l.match(/^\d+/)
                header = l.to_s.split
        else

                (td, data) = l.split(/:/).map
                time = Time.at(td.to_i)
                printf("%s:", time.strftime("%Y-%m-%d %H:%M:%S"))

                data.to_s.split.map do |d|
                        if (d.eql? "nan") then d = "0.00" end
                        printf(" | %20.2f", d.chomp)
                end
        end

        if(count == 1)
                printf("%20s", "Time")
                header.each do |h|
                        printf(" | %20s",h)
                end
        end
        puts "\n"
end

and you use it like so

rrdtool fetch rra/.rrd AVERAGE -s -1h -r 60  | ./readRRD.rb

and here is some sample output

1   |                 Time |   Heap_Mem_Committed |         Heap_Mem_Max |        Heap_Mem_Used | Non_Heap_Mem_Commit |    Non_Heap_Mem_Init |     Non_Heap_Mem_Max |    Non_Heap_Mem_Used |             CPU_TIME |            User_Time |         Thread_Count |    Peak_Thread_Count |        Heap_Mem_Init
2   |
3   | 2009-08-03 13:18:00: |         213295104.00 |         532742144.00 |         130720632.67 |          36405248.00 |          12746752.00 |         100663296.00 |          36383328.00 |         623333333.33 |         531666666.67 |               111.33 |               184.00 |                 0.00
4   | 2009-08-03 13:19:00: |         213295104.00 |         532742144.00 |         132090801.60 |          36405248.00 |          12746752.00 |         100663296.00 |          36383328.00 |        1818000000.00 |        1704000000.00 |               111.80 |               184.00 |                 0.00
5   | 2009-08-03 13:20:00: |         213295104.00 |         532742144.00 |         122721880.67 |          36405248.00 |          12746752.00 |         100663296.00 |          36383328.00 |        2186666666.70 |        2057500000.00 |               112.92 |               184.00 |                 0.00

July 31, 2009

It is System Administrator Appreciation Day

Filed under: Uncategorized — @ 3:00 pm

The Last Friday in July, so don’t forgot to shower your favorite System Administrator with praise and caffeine. Otherwise they might be sleepy when the Gremlins attack your Servers.

http://www.sysadminday.com/index2009.html

« Newer Posts

Powered by WordPress